NOAA NCTR experimental research product Not an official forecast |
Model and Data Comparison Plots
Tohoku Tsunami Event Page | Web Link Compilation | Model and Data Comparison Plots
Model and DART® buoy data / tide gauge data comparison
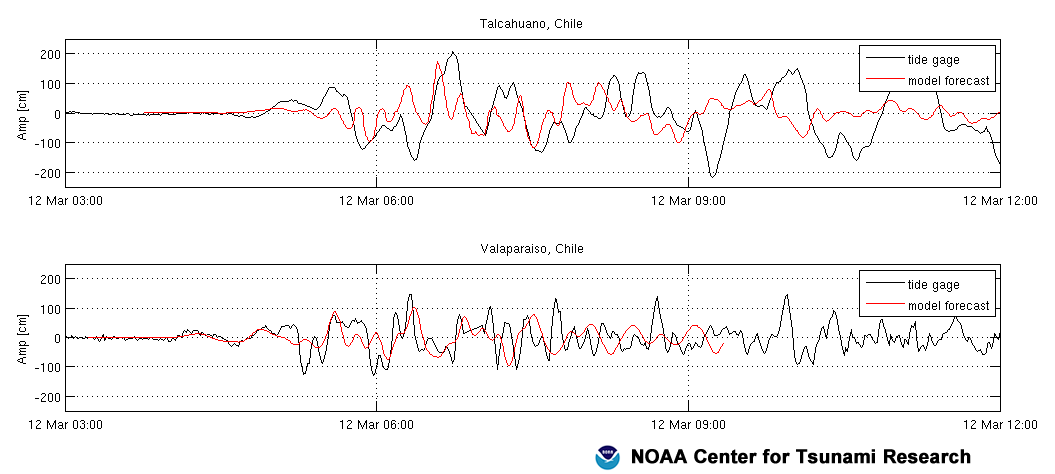
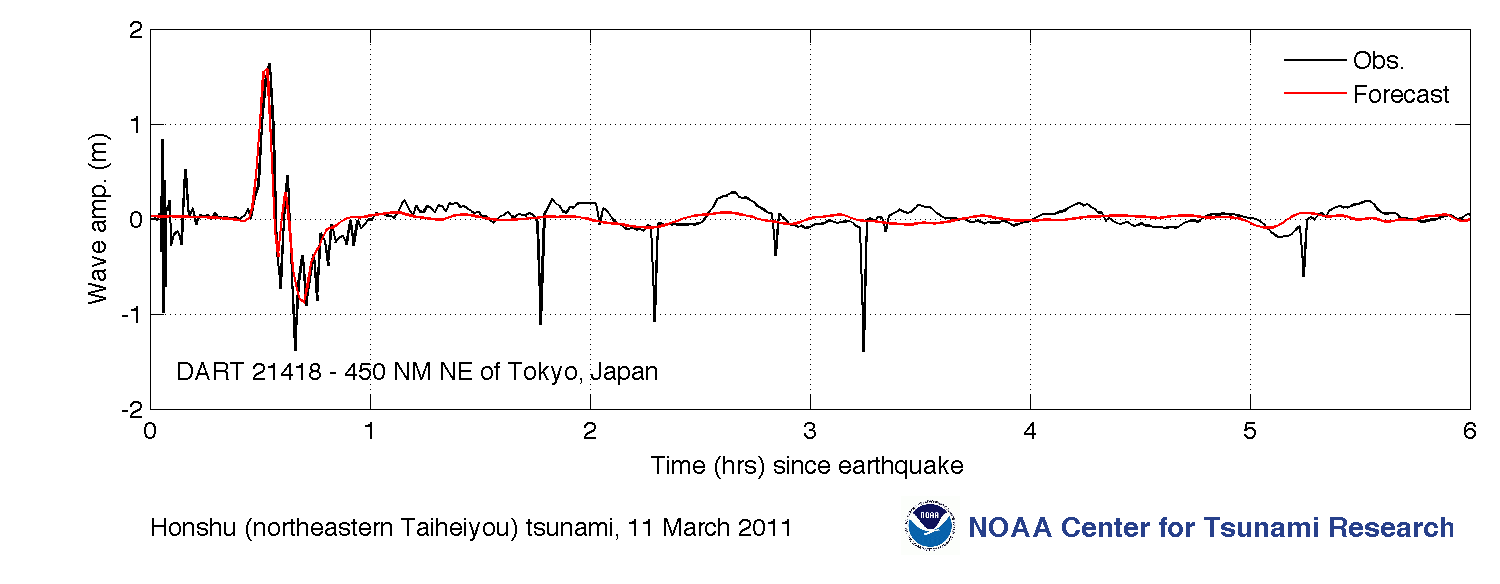
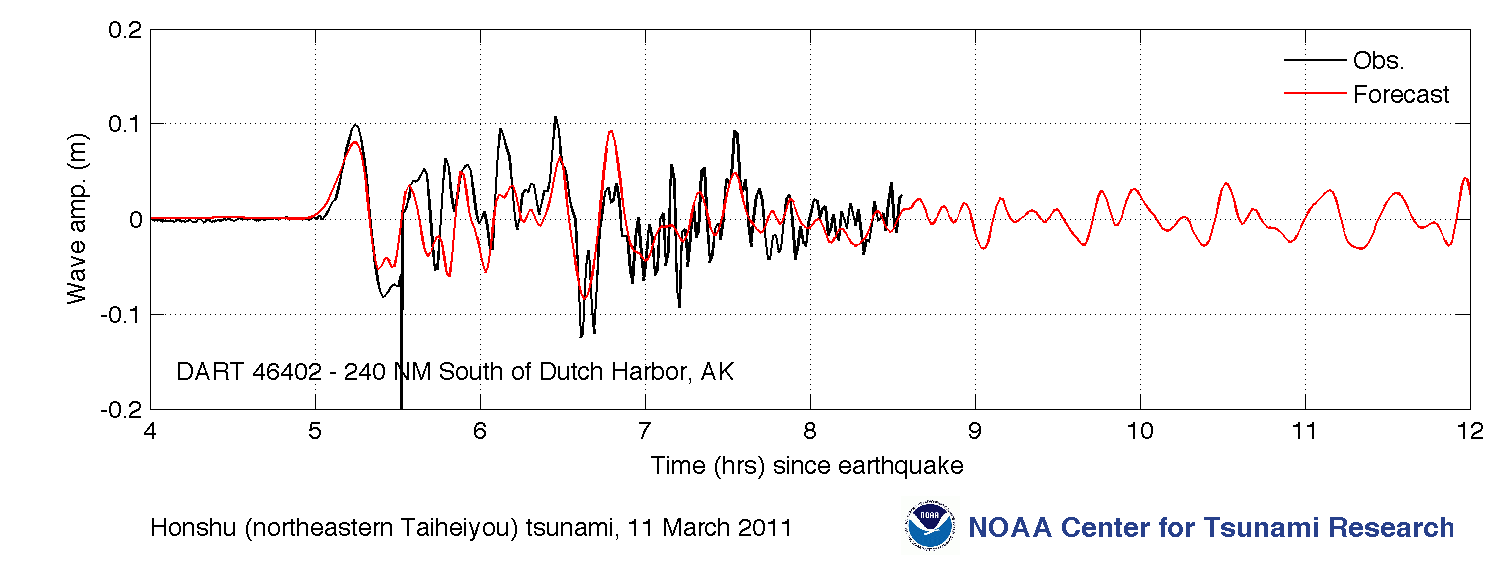
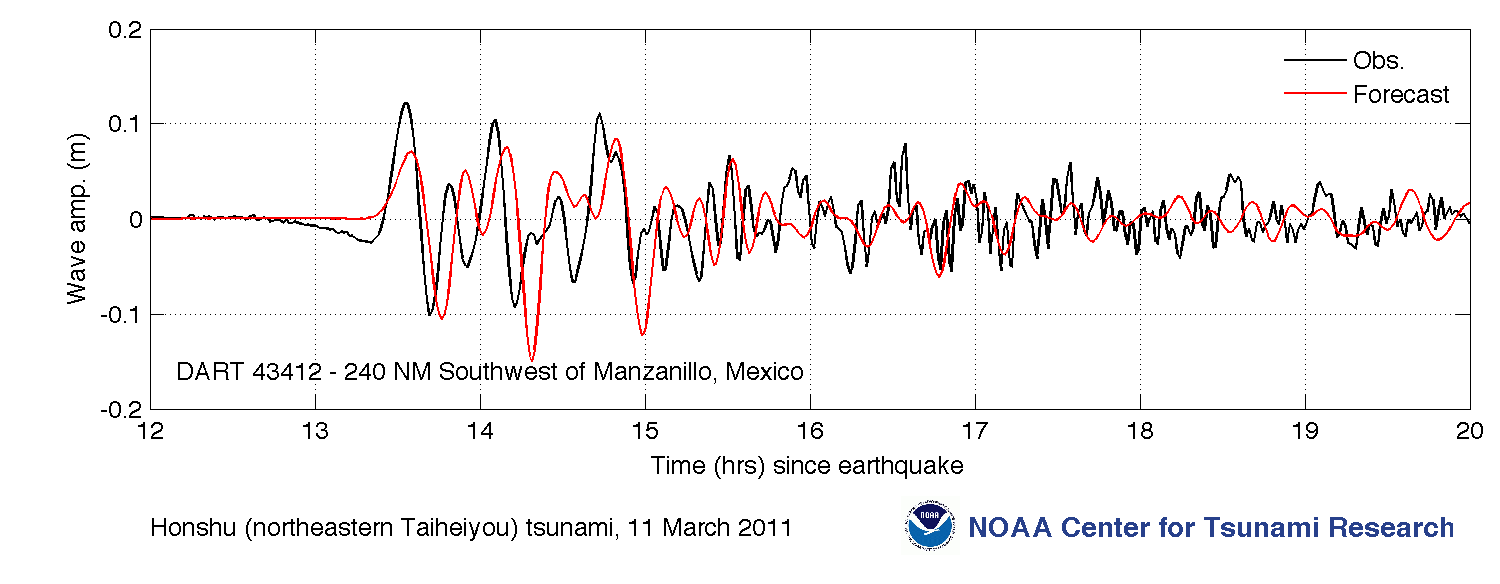
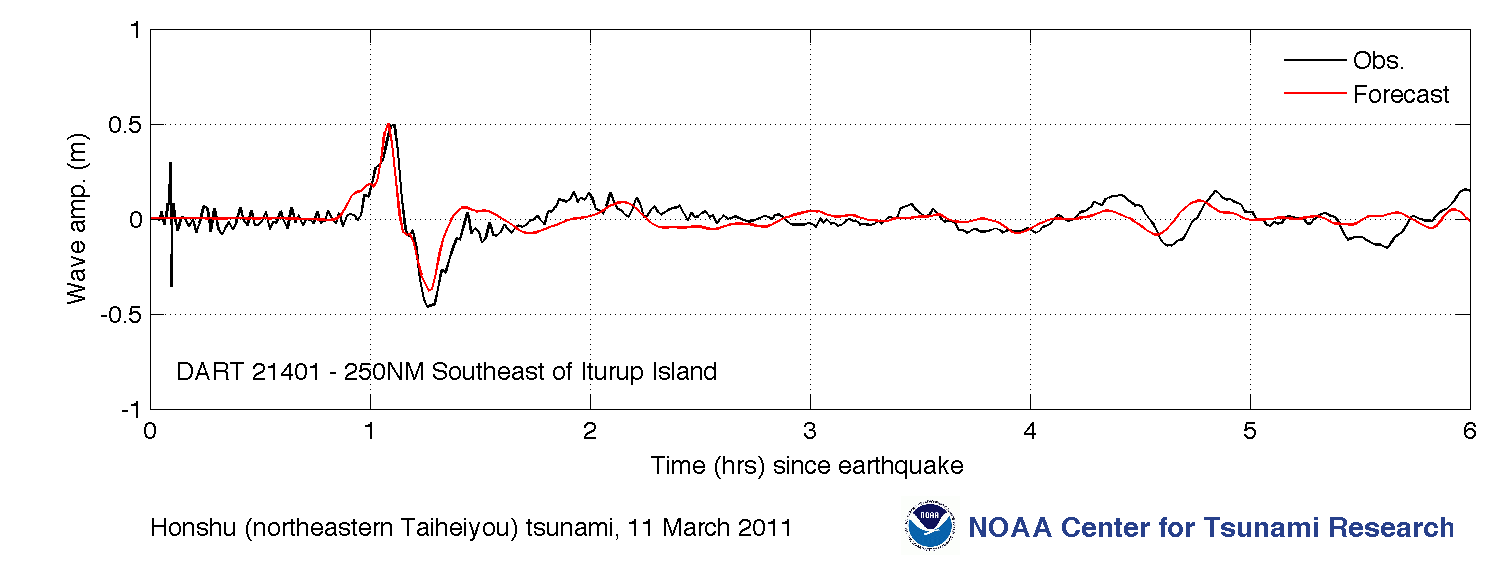
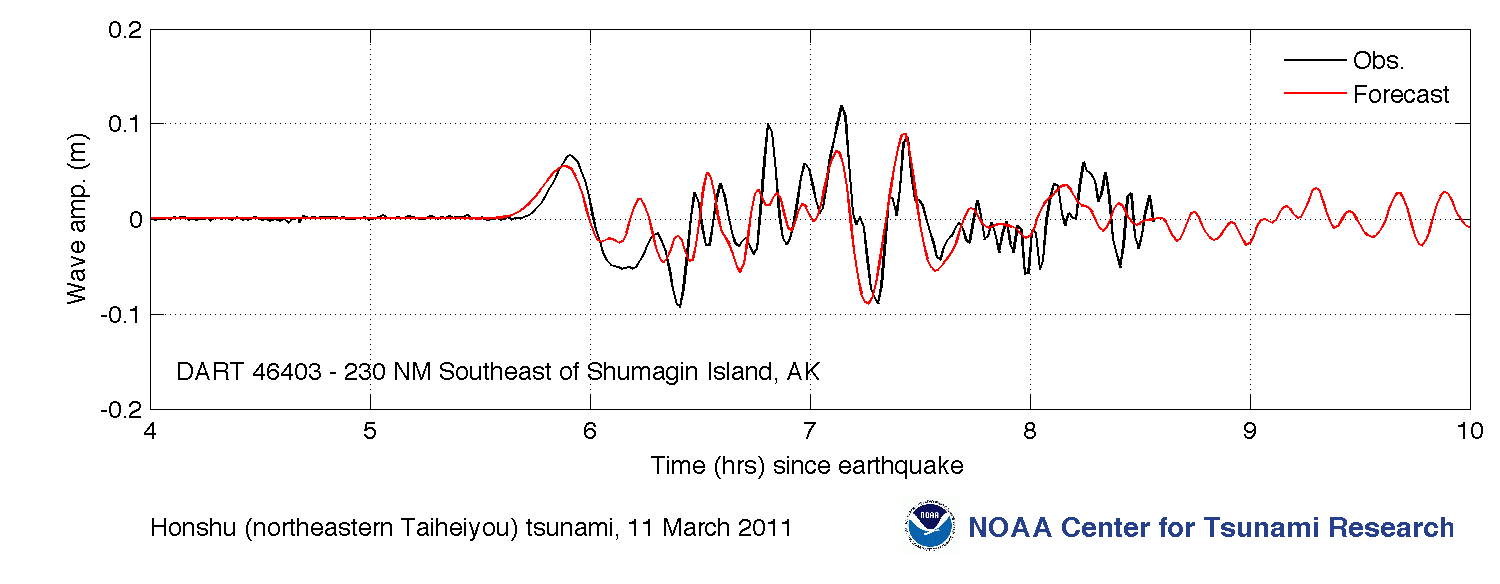
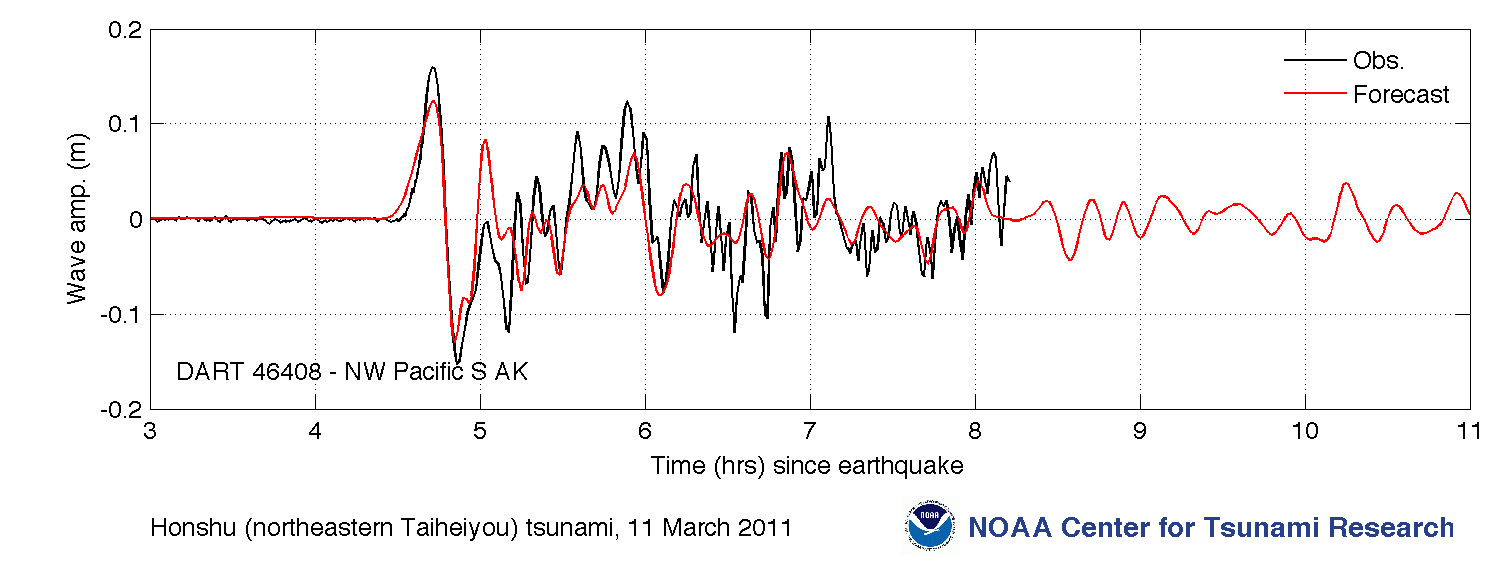
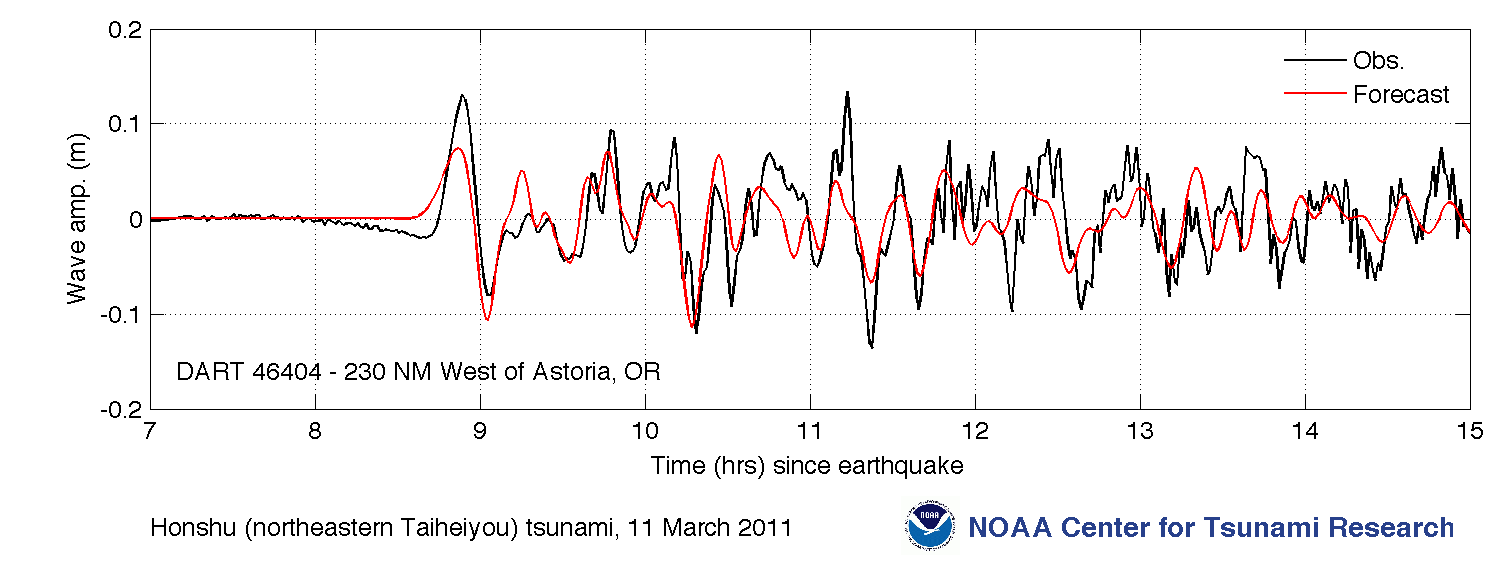
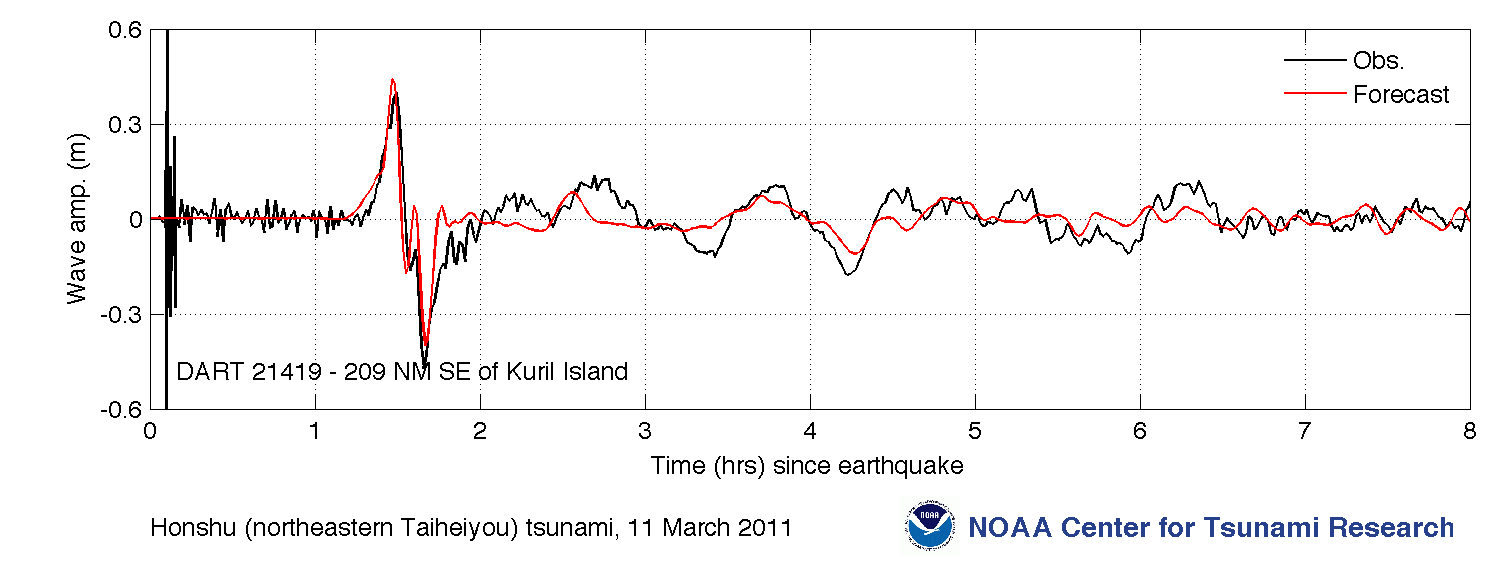
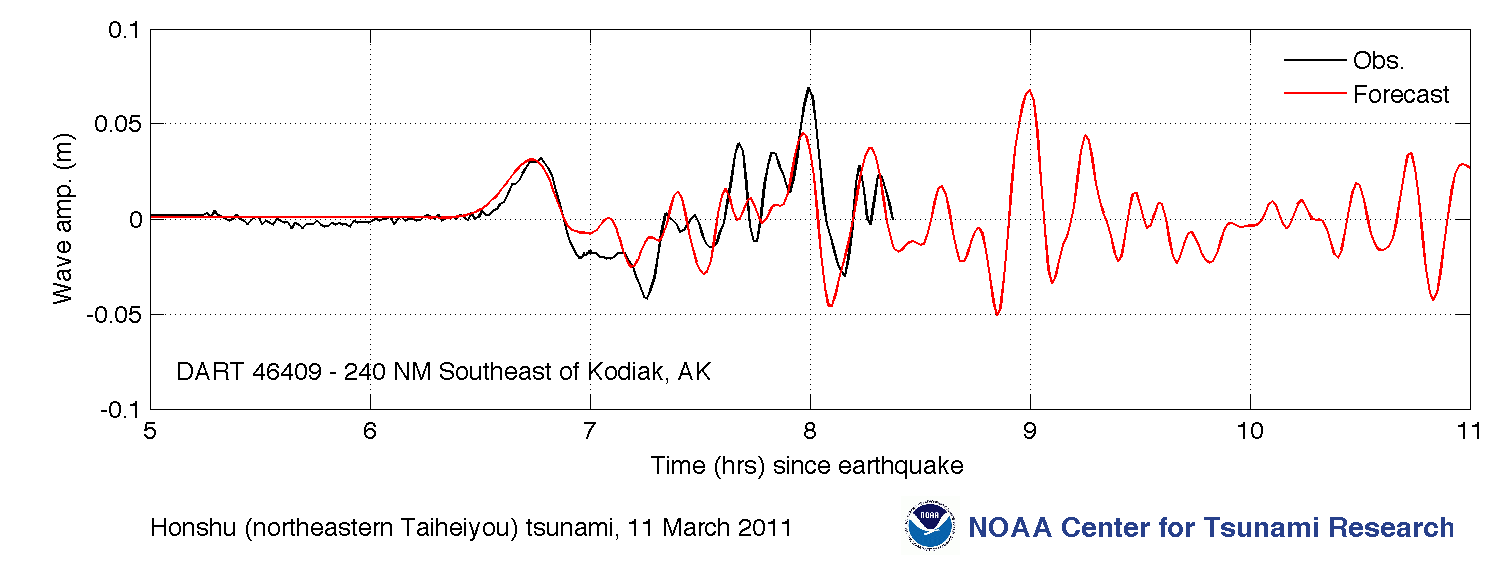
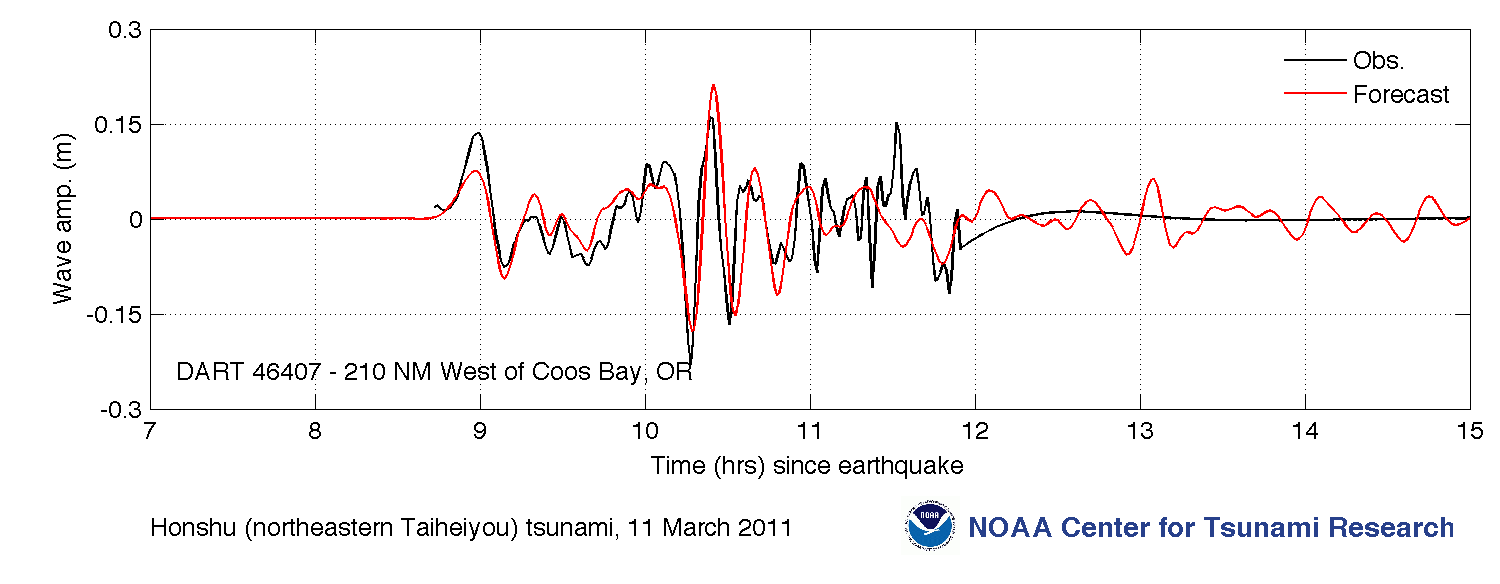
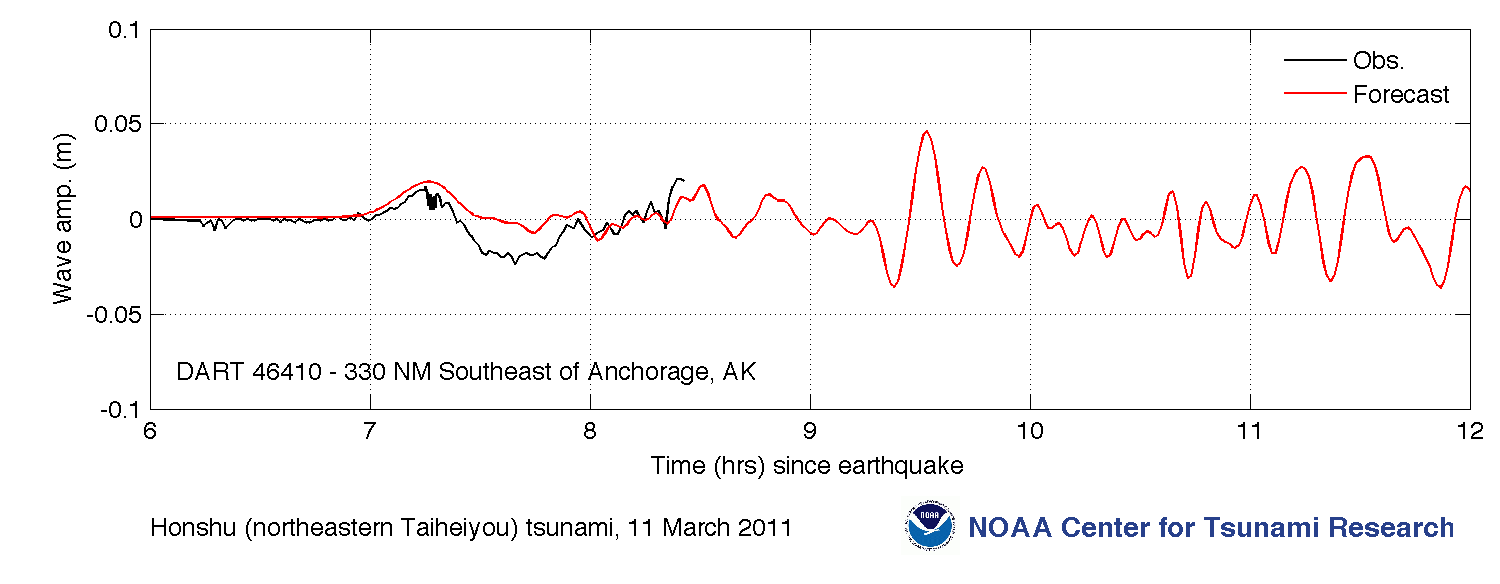
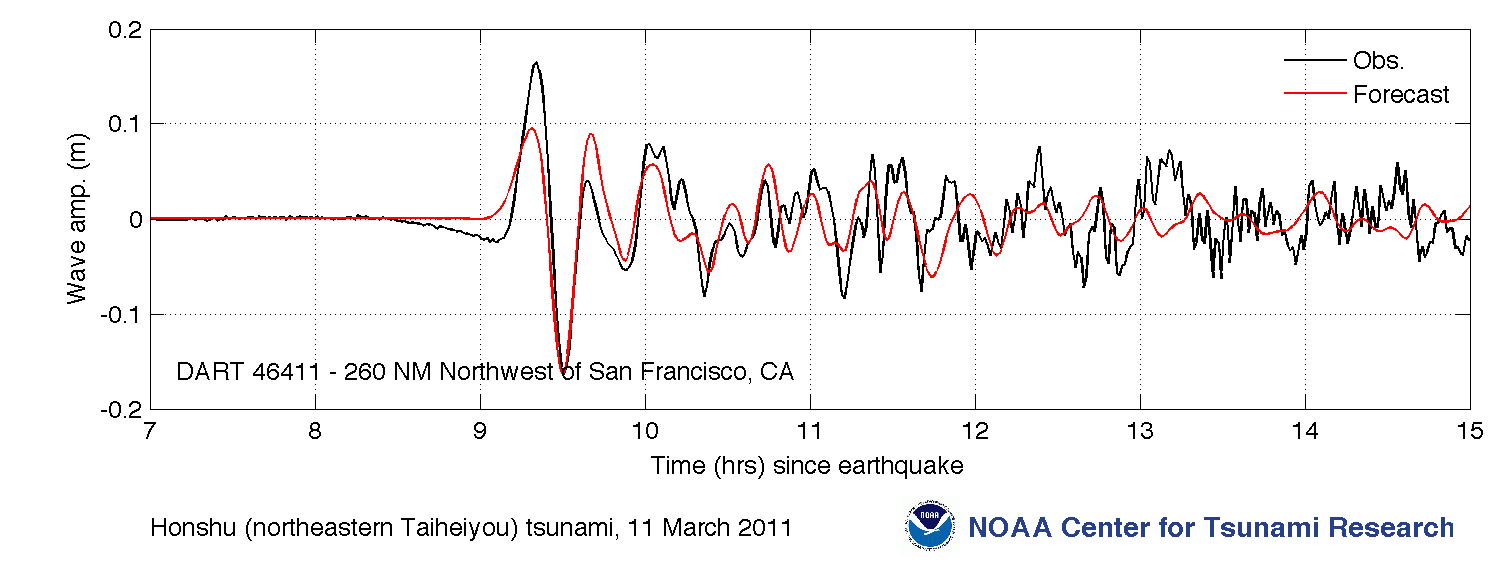
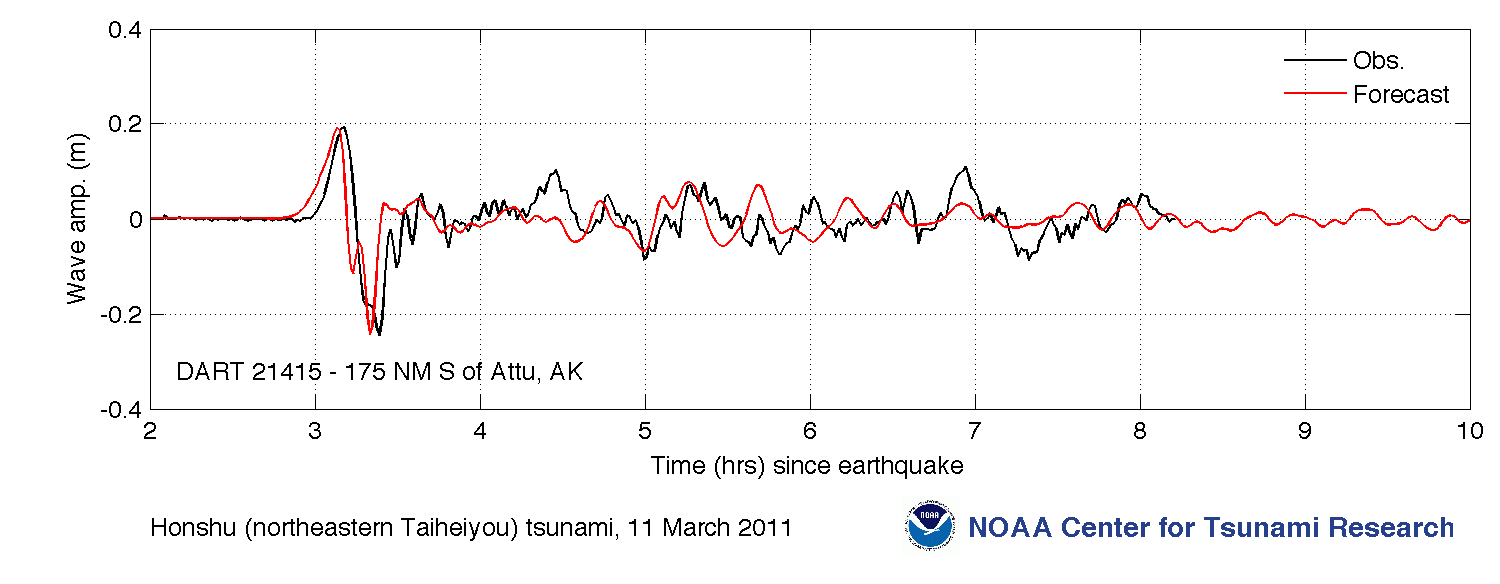
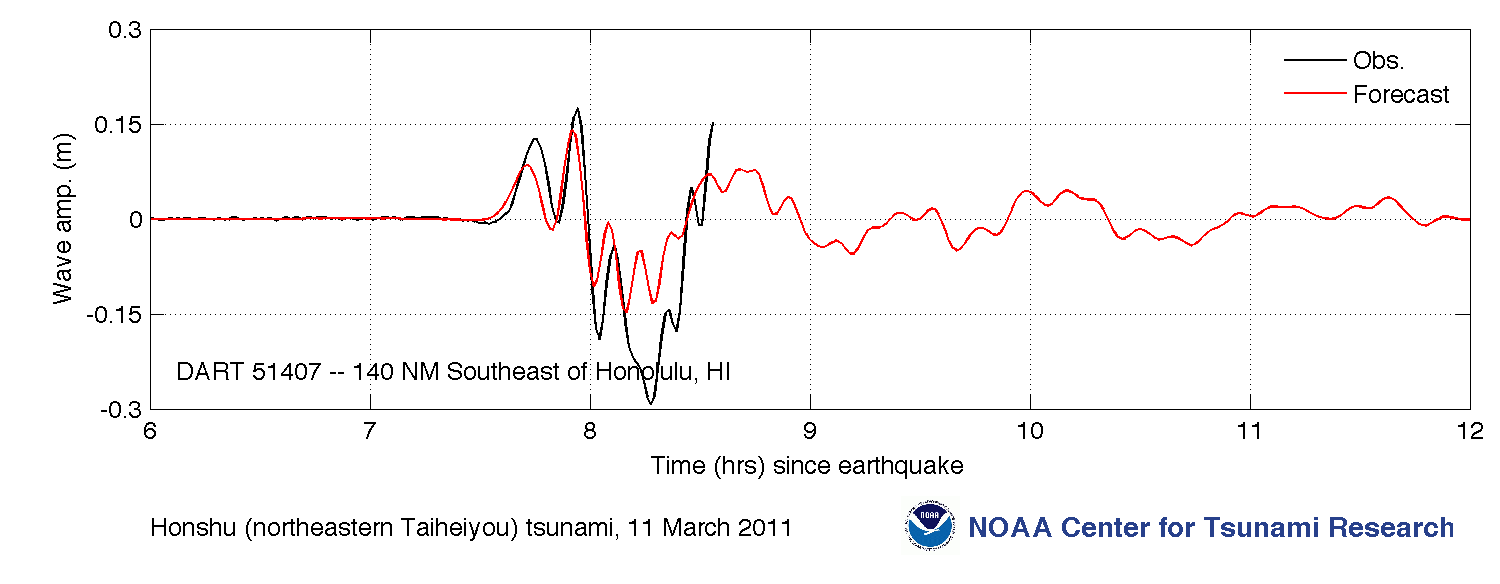
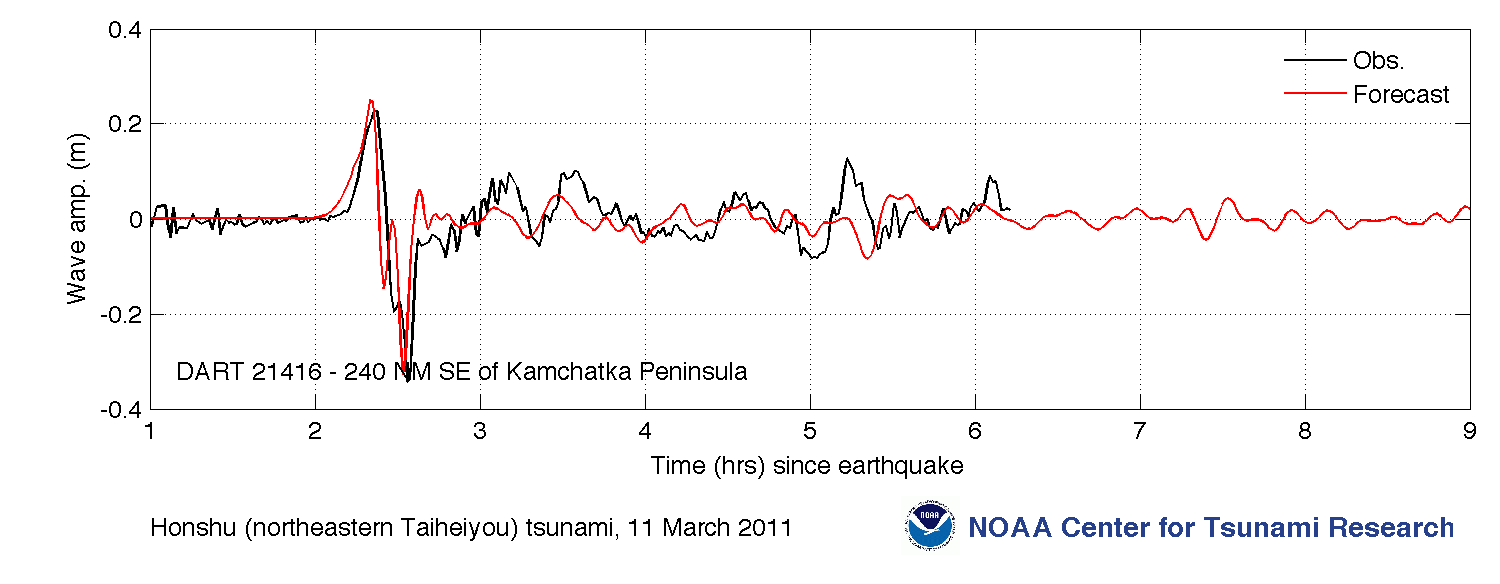
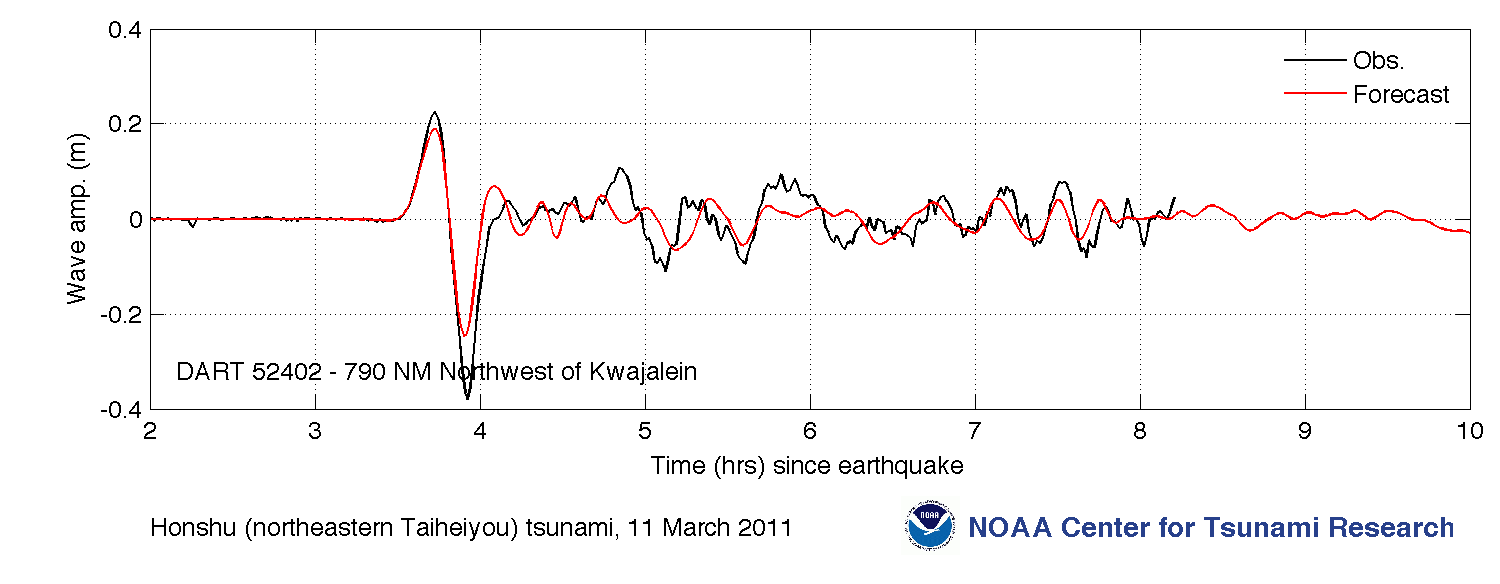
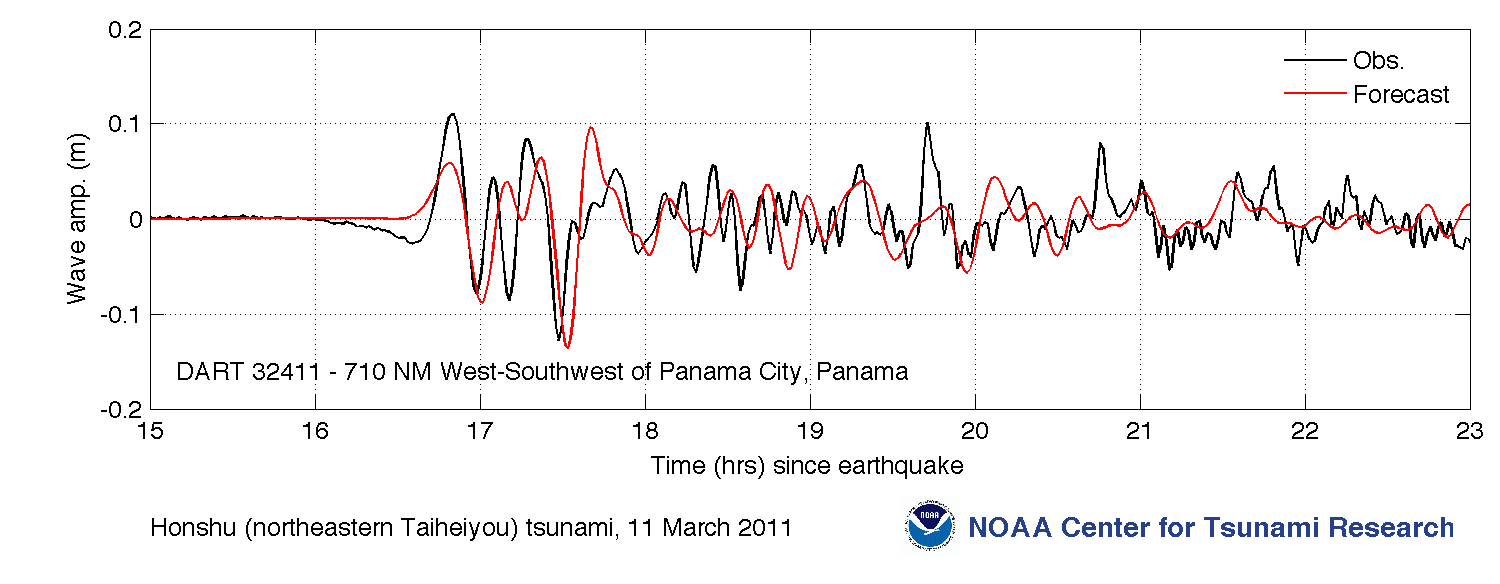
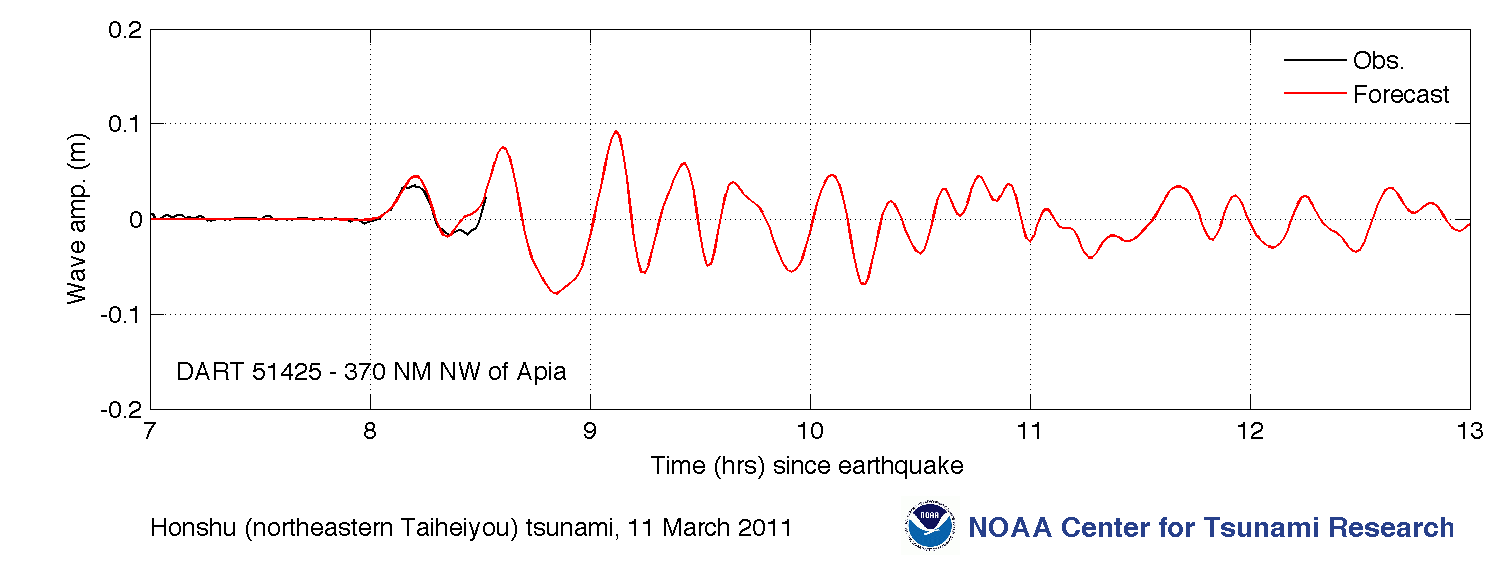
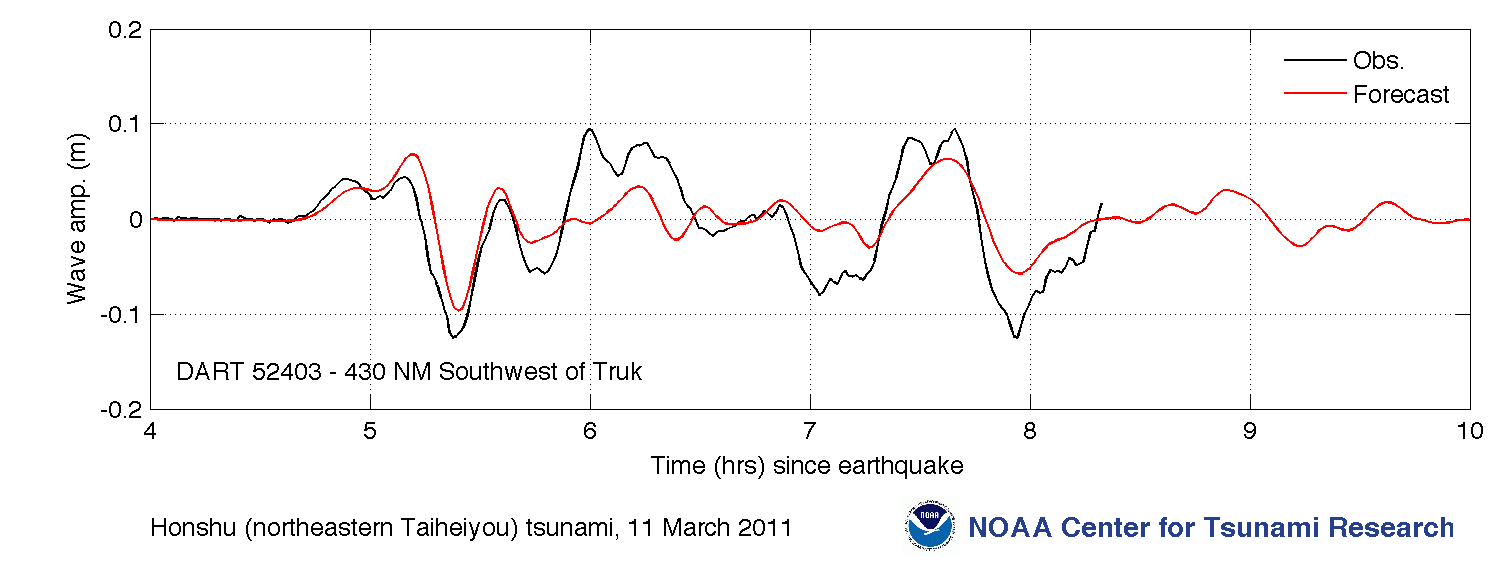
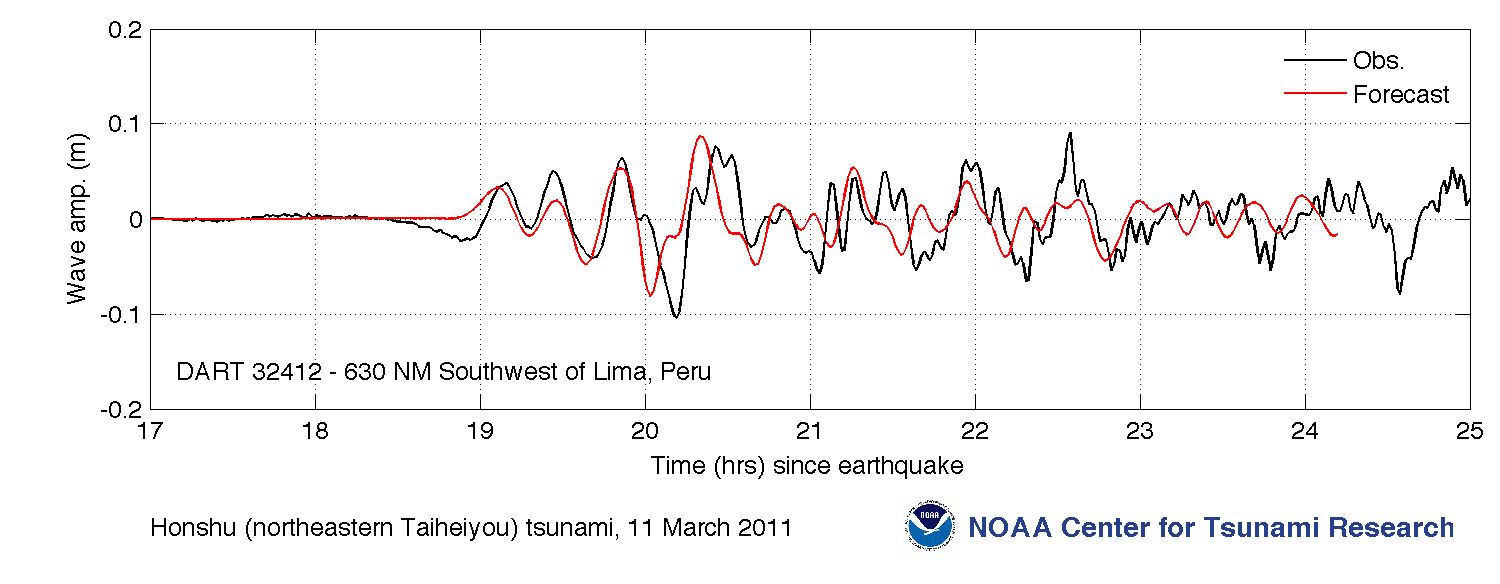
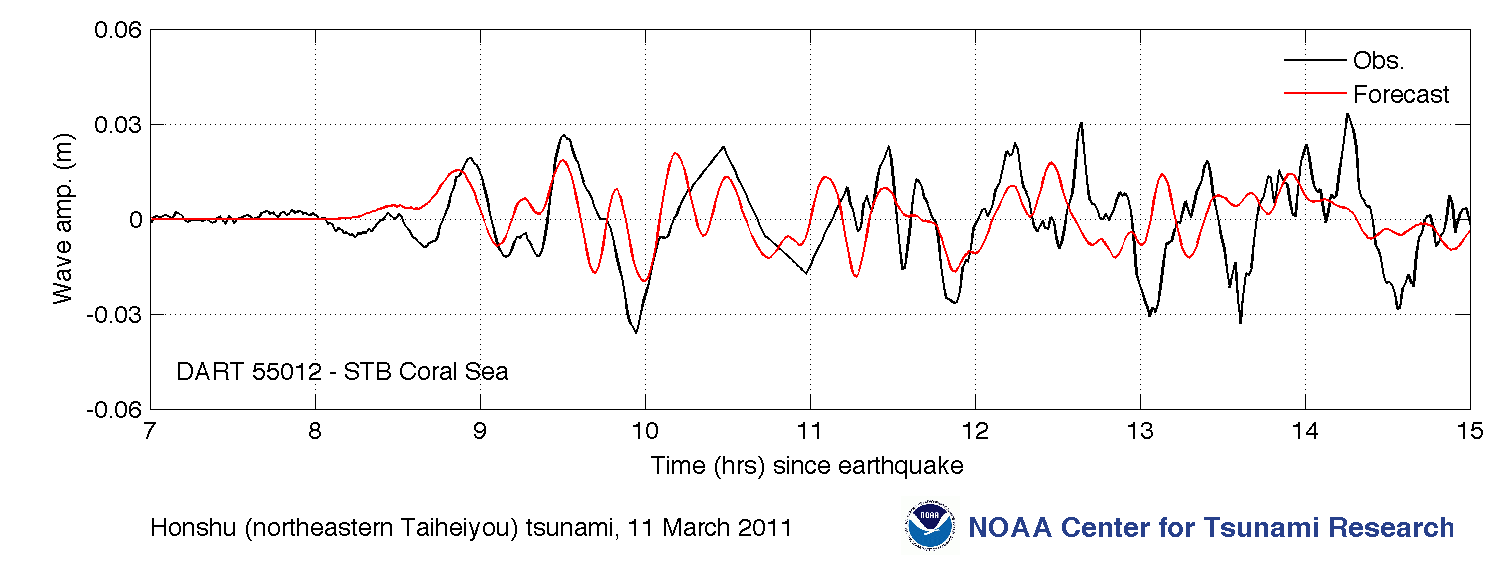
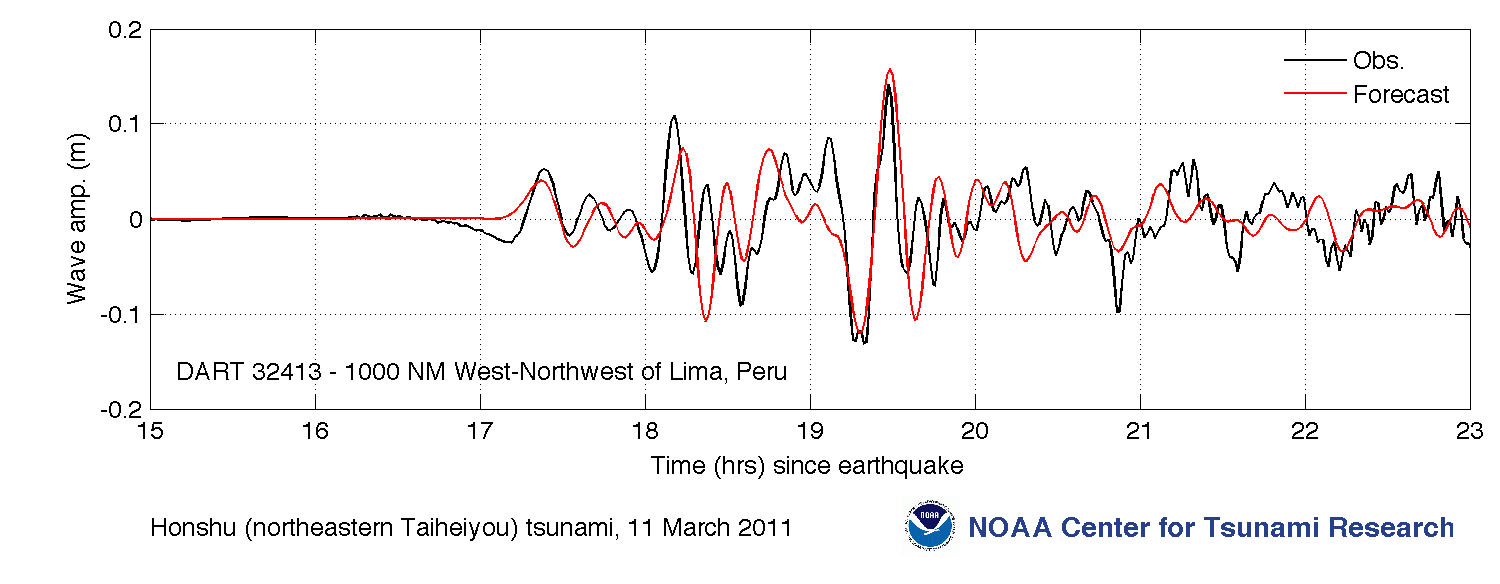
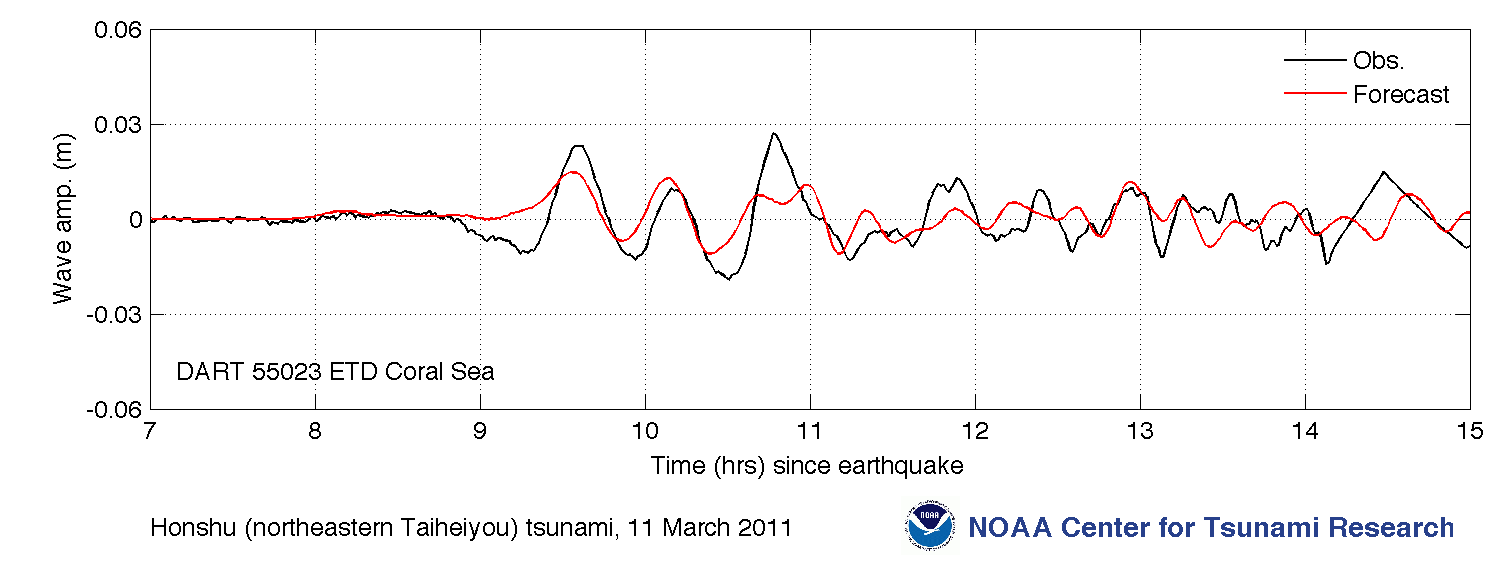
- Comparison of the March 11, 2011 Honshu tsunami recorded at DARTs and sea-level gauges in the Pacific and along U.S. coastlines with model forecasts. The DART model timeseries are obtained from the pre-computed generation/propagation forecast database in real time, after fitting models to tsunami records from two closest DARTs (21418 and 21401). The flooding forecast models (high-resolution inundation models for coastal locations) were run in real time before the tsunami reached the locations shown. The model data for Hawaii, the U.S. West Coast and South America show 3 to 15 minute early arrival (less than 2.5% error accumulated during the propagation simulation). The plots show model data for those locations with time shifted later for comparison purposes. (see References, below).
Tide Gauges
DARTs
- Comparison of model data with DART® data
- Comparison of model data with DART® data
Disclaimer: The forecasts on these pages show the results of ongoing research to enhance tsunami science and to improve NOAA operational tsunami forecasts. These products were developed during or shortly after the tsunami event, are intended for research use, and are not an official forecast. They should not be used as the basis of any public or private policy decisions. Please contact NCTR to find if there are more detailed follow-on analysis results.
Click to see NCTR metadata.
References:
Tang, L., V. V. Titov, and C. D. Chamberlin (2009), Development, testing, and applications of site-specific tsunami inundation models for real-time forecasting, J. Geophys. Res., 114, C12025, doi:10.1029/2009JC005476. [PDF version]
Titov, V.V. (2009): Tsunami forecasting. Chapter 12 in The Sea, Volume 15: Tsunamis, Harvard University Press, Cambridge, MA and London, England, 371–400.
Wei, Y., E. Bernard, L. Tang, R. Weiss, V. Titov, C. Moore, M. Spillane, M. Hopkins, and U. Kânoğlu (2008): Real-time experimental forecast of the Peruvian tsunami of August 2007 for U.S. coastlines. Geophys. Res. Lett., 35, L04609, doi: 10.1029/2007GL032250. [PDF Version]
For media inquiries:
When using information from this page, please credit NOAA / PMEL / Center for Tsunami Research