|
Tsunami Hazard Assessment for Guam
Introduction:
The NOAA Center for Tsunami Research (NCTR) is working with NOAA's National Ocean Service (NOS) to conduct a tsunami hazard assessment study for the Island of Guam.
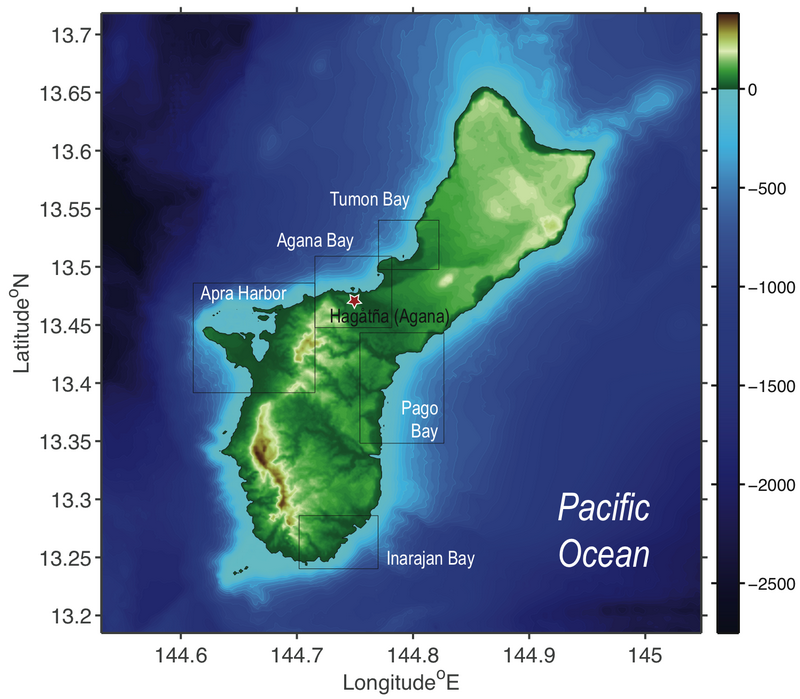
The Island of Guam consists of five bays vulnerable to tsunami damage. Apra Harbor is the site of an NOS tide gauge and the biggest harbor on the island. Tumon Bay, Pago Bay, Agana Bay and Inarajan Bay are densely populated areas that require careful investigation. (right)
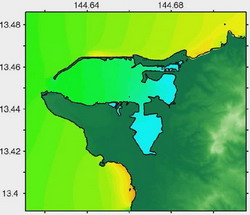
NOS has provided new bathmetric survey data for the Island, and the NCTR is developing numerical computer grids, with the highest possible resolution, that can be used with a tsunami inundation model to compute tsunami impact for different sections of the island . Testing the stability and accuracy of the grids with the MOST tsunami computer model is a vital step in the development of reliable grids to be used in tsunami warning, education and evacuation.
Methodology:
The work is divided into five phases. The first stage involves setting up the grids. LIDAR, SRTM, USGS topography and multibeam surveys are combined into one set of digital elevation maps with the help of GIS software .
During the second phase, the higher resolution grids are designed and tested with historical data and with preliminary worst-case inundation scenarios for robustness and stability.
|
|
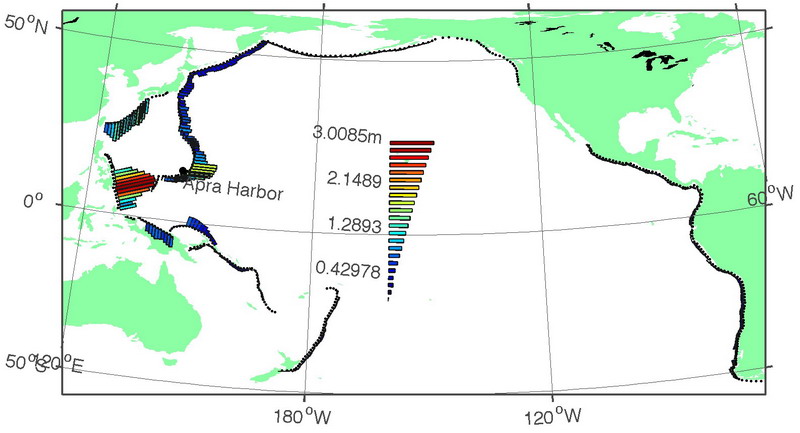
The third phase involves the development of a computationally inexpensive version of the high resolution grids. Three different magnitude events (Mw 7.6, 8.8 and 8.9) are modeled on twelve different subduction zones with more than 1200 scenarios in order to determine the tsunamigenic effective source regions. The results are combined with data from tsunami catalogues and geological information to determine the scenarios that are to be used in the final inundation study in the fourth phase, where the maximum runup heights, inundation distances and numerical wave gauge results are computed for the most dangerous Pacific wide tsunami scenarios.
In the fifth and last phase, a technical report will be written and results will be presented to local emergency managers for future tsunami hazards studies. This study will also be incorporated into NCTR’s real time tsunami forecasting study.
References
Ando, M. (1975). Source mechanism and tectonic significance of historical earthquakes along the Nankai through, Japan. Tectonophysics, 27:119–140.
Berkman, S.C. and J.M. Symons (1964?). The tsunami of May 22, 1960 as recroded at tide stations, U.S. Dept. of Commerce, C&GS, Washington 25, D.C., 69 pp.
Lander, J. F., Lockridge, P., and Kozuch, M. (1993). Tsunamis Affecting the West Coast, US 1806-1992. Technical report, U.S. Department of Commerce.
Soloviev, S. L. and Go, C. N. (1974). Catalog of tsunamis on the western shore of the Pacific Ocean. Technical report, Nauka Publishing House, Moscow.
Spaeth, M.G. and S.C. Berkman (1967). The tsunami of March 28, 1964, as recroded at tide stations, ESSA Technical Report C&GS 33, U.S. Dept. of Commerce, ESSA, C&GS, 86 pp.
Titov, V. V. and Gonz ́alez, F. (1997). Implementation and testing of the method of splitting tsunami (MOST) model. Technical Memorandum ERL PMEL 112, NOAA.
Titov, V. V. and Synolakis, C. E. (1998). Numerical modelling of tidal wave runup. J. Waterw. Port Coast. Ocean Eng., 124:157–171.
Tang, L., C. Chamberlin, E. Tolkova, M. Spillane, V.V. Titov, E.N. Bernard, and H.O. Mofjeld (2006): Assessment of potential tsunami impact for Pearl Harbor, Hawaii. NOAA Tech. Memo. OAR PMEL.
Zerbe, W.B. (1953). The tsunami of November 4, 1952, as recroded at tide stations, C&GS Special Publication #300, U.S. Dept. of Commerce, C&GS, 62 pp.