Not an official forecast
Tsunami Event - August 10, 2009 Andaman Islands
Main Event Page
NOAA News Feature! How to Forecast a Wave: Indian Ocean Tsunami Tests NOAA’s New Forecast System
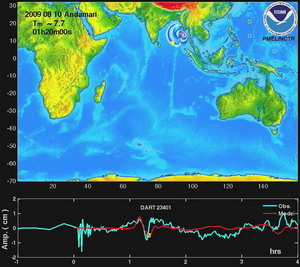
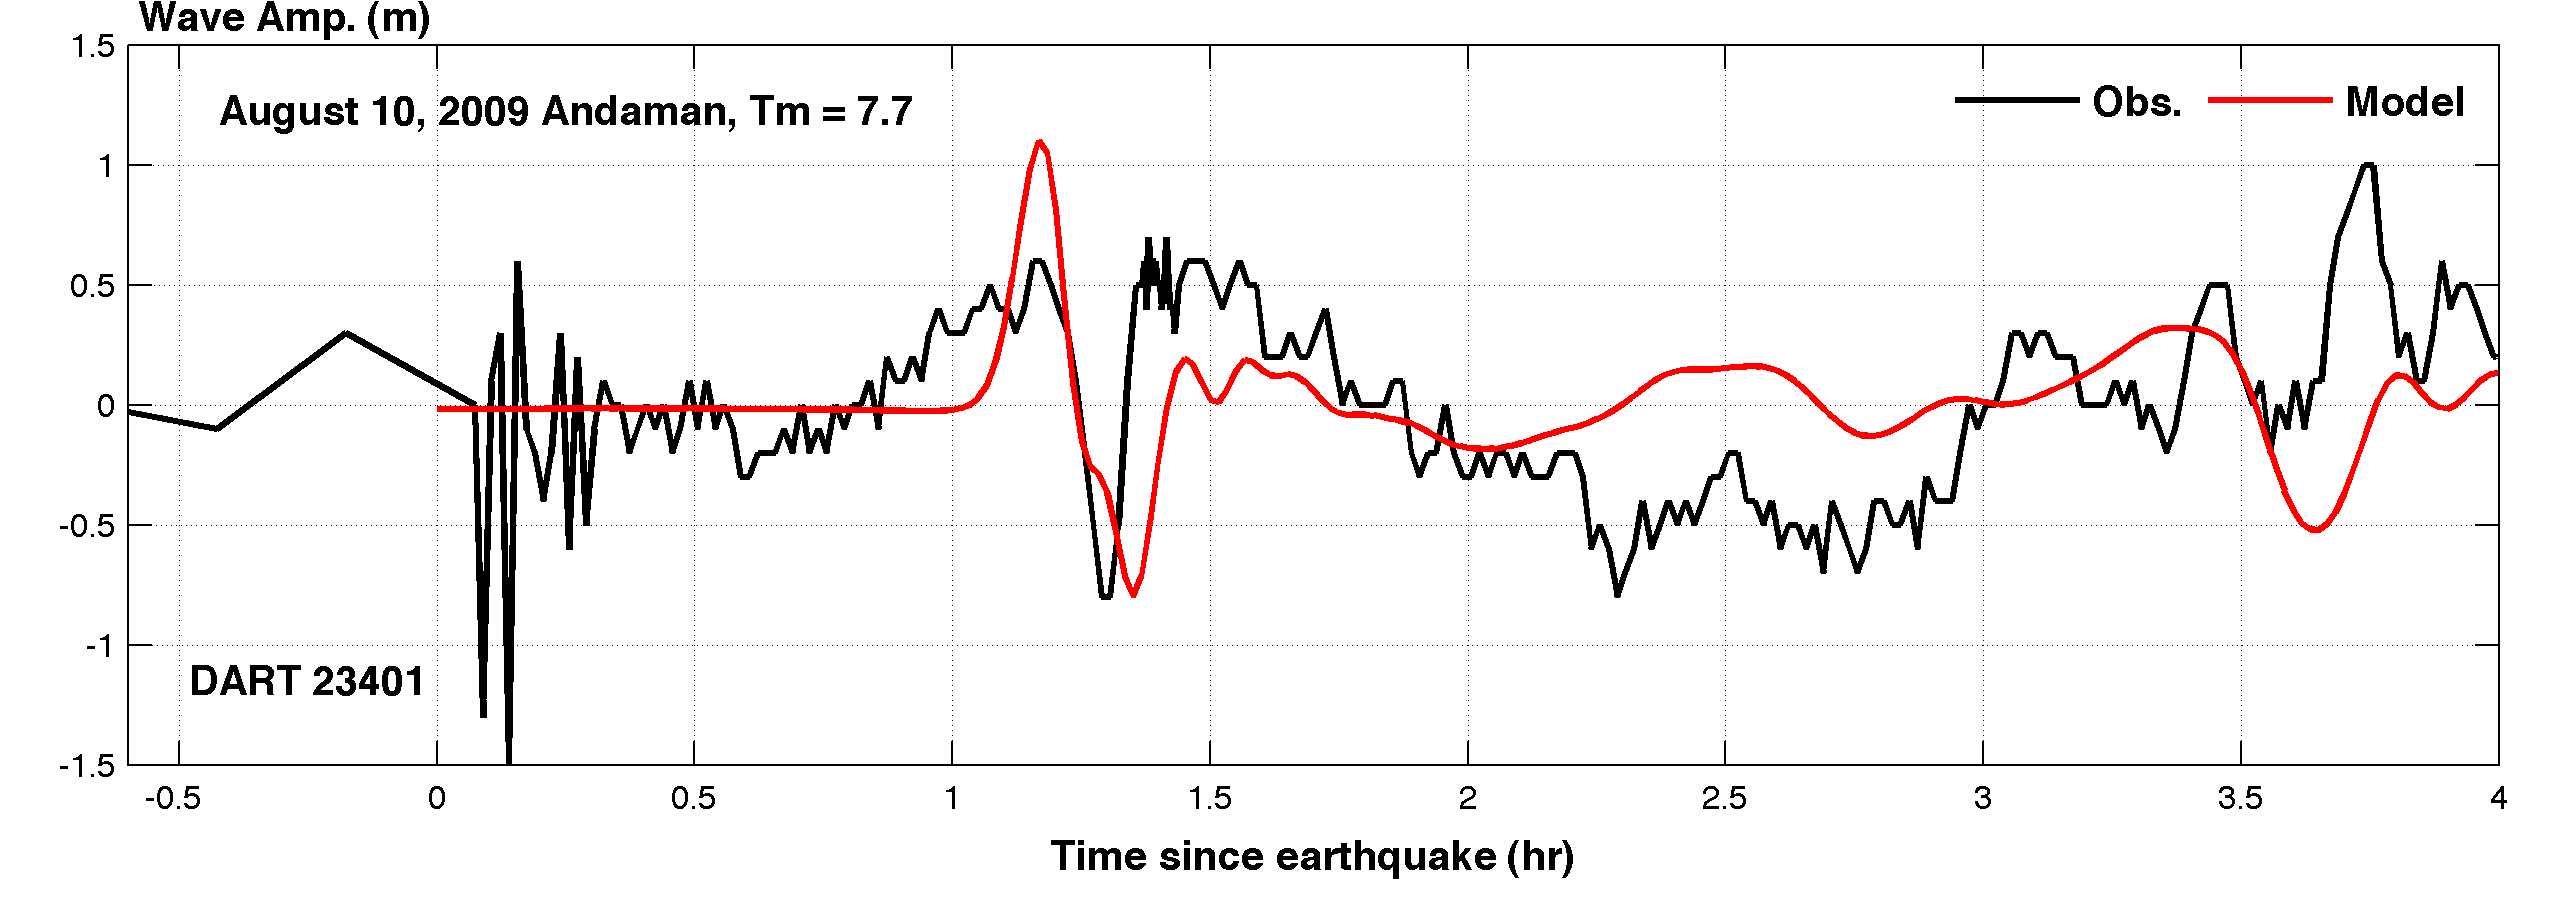
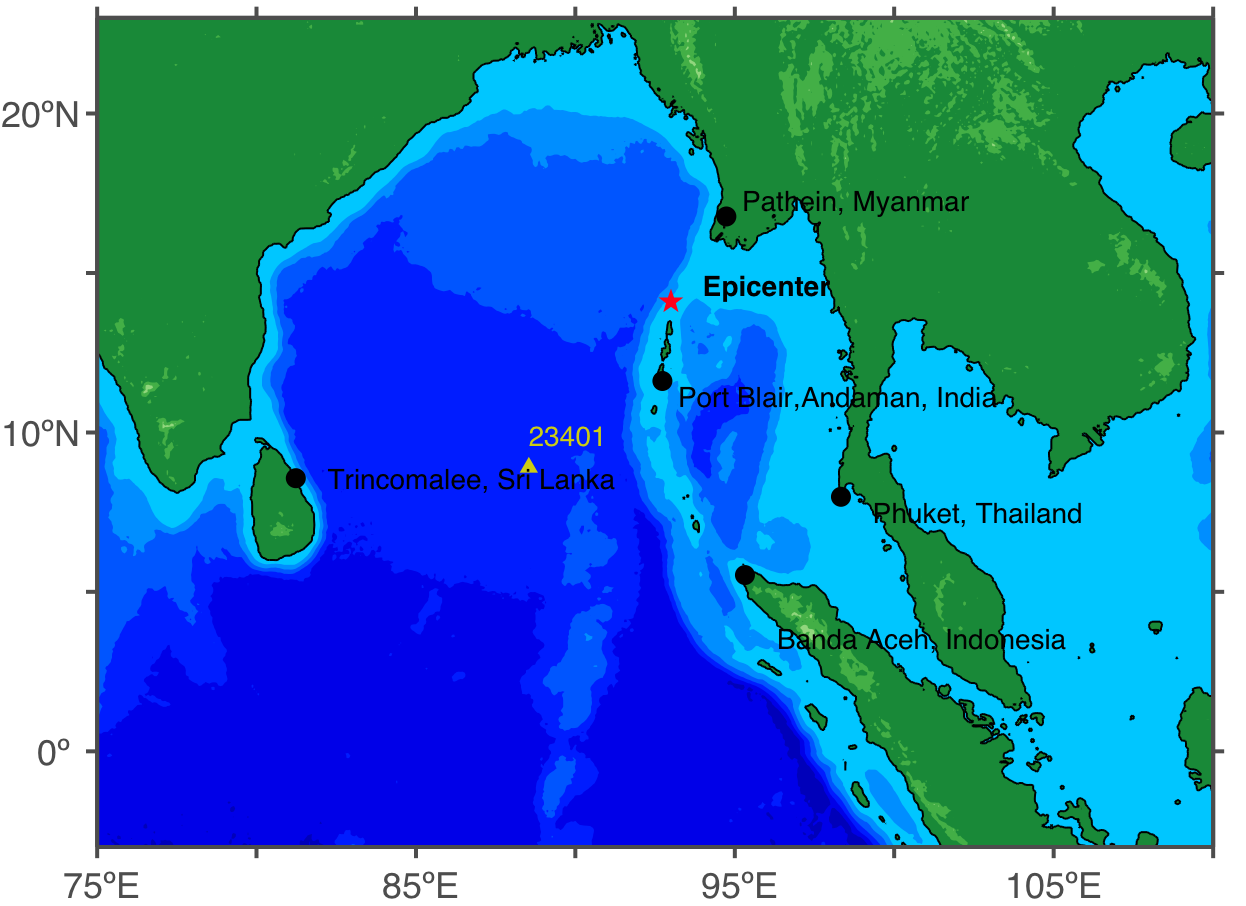
The Andaman Islands tsunami was generated by a shallow Mw 7.7 earthquake (14.1˚ N, 93.0˚ E), at 19:56 UTC, about 260 km N of Port Blair, Andaman Islands, India (according to NOAA PTWC tsunami-watch statement issued 9 minutes after the earthquake). In approximately an hour, the tsunami was recorded at DART® buoy 23401. Research forecast results shown below were created in real time (during the tsunami propagation) with the NOAA forecast method using MOST model with the tsunami source inferred from DART® data.
 Tsunami propagation animation (8.3 MB), shows propagation dynamics of the research forecast model computed with the MOST.
Click to animate. Tsunami propagation animation (8.3 MB), shows propagation dynamics of the research forecast model computed with the MOST.
Click to animate. |
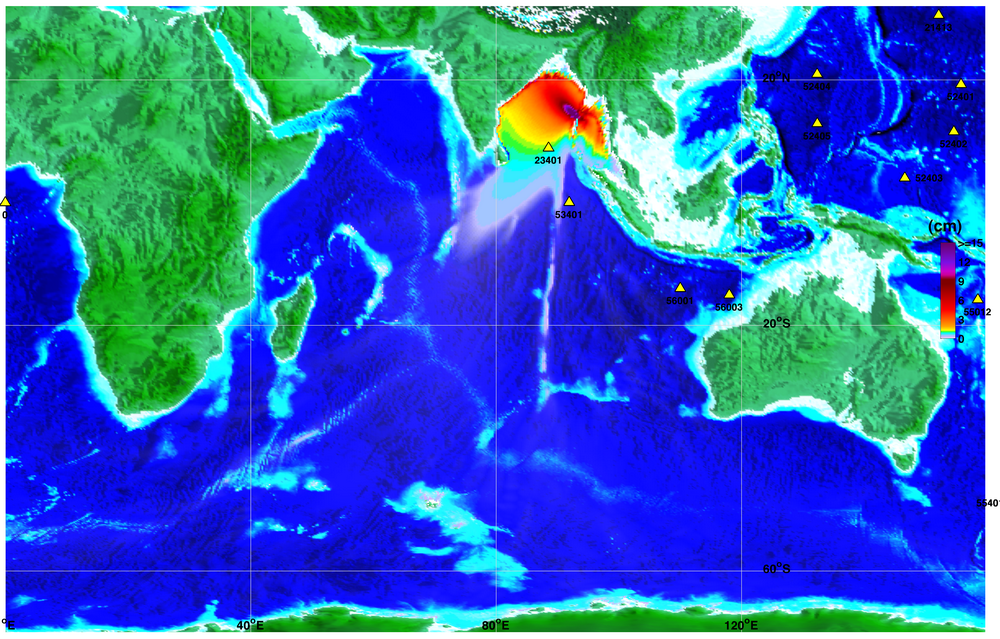 Maximum wave amplitude distribution created with the MOST forecast model. Triangles indicate DART® buoy locations. Maximum wave amplitude distribution created with the MOST forecast model. Triangles indicate DART® buoy locations. Click to see larger image. |
The graphics above display forecast results, showing qualitative and quantitative information about the tsunami, including tsunami wave interaction with ocean floor bathymetric features, and neighboring coastlines. Tsunami model amplitude information is shown color-coded on top of blue-shaded sea floor bathymetry.
Additional Resources:
Pacific Tsunami Warning Center event page
USGS event page
For media inquiries:
When using information from this page, please credit NOAA / PMEL / Center for Tsunami Research