Not an official forecast
Tsunami Event - April 1, 2007 Solomon Islands
Main Event Page
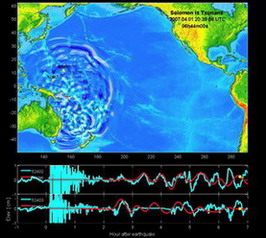
The Solomon Islands tsunami was generated by a Mw 8.1 earthquake (8.430°S 157.060°E), 2007-04-01 20:39:56 UTC (according to the USGS).
Animations of the April 1, 2007 Solomon Islands tsunami propagation created with research runs of the MOST tsunami forecast model and including DART® buoy data. Yellow squares indicate DART® buoy locations. Click the image to animate (left) or enlarge (right).
 |
 |
Propagation in the Pacific Ocean (14.2 MB animation). Click to animate. |
Maximum wave height distribution (image). Click to see larger image. |
The animation and graphic display qualitative and quantitative information about the tsunami propagation including tsunami wave interaction with ocean floor bathymetric features, and neighboring coastlines. The tsunami radiation pattern is indicated with color coded information about the maximum wave height at different locations throughout the Pacific Ocean.
The timer and moving yellow squares indicate time elapsed since time of the earthquake, providing an estimate of tsunami arrival time at different locations (left). Please note that part of the 1 minute data of 52403 DART is missing and is displayed as a straight line on the animation plot.
Unit Sources: 12.0*b10
Selected links:
- Solomon Islands event links from NOAA/NGDC
- Solomon Island event links from the Disaster Control Research Center, Tohoku University, Japan
- Solomon Islands analysis from USGS
- Deadly Tsunami Hits Solomon Islands, in Sound Waves,a USGS Monthly Newsletter
For media inquiries:
When using information from this page, please credit NOAA / PMEL / Center for Tsunami Research