Not an official forecast
Pijijiapan, Mexico Tsunami, September 8, 2017
Main Event Page
|
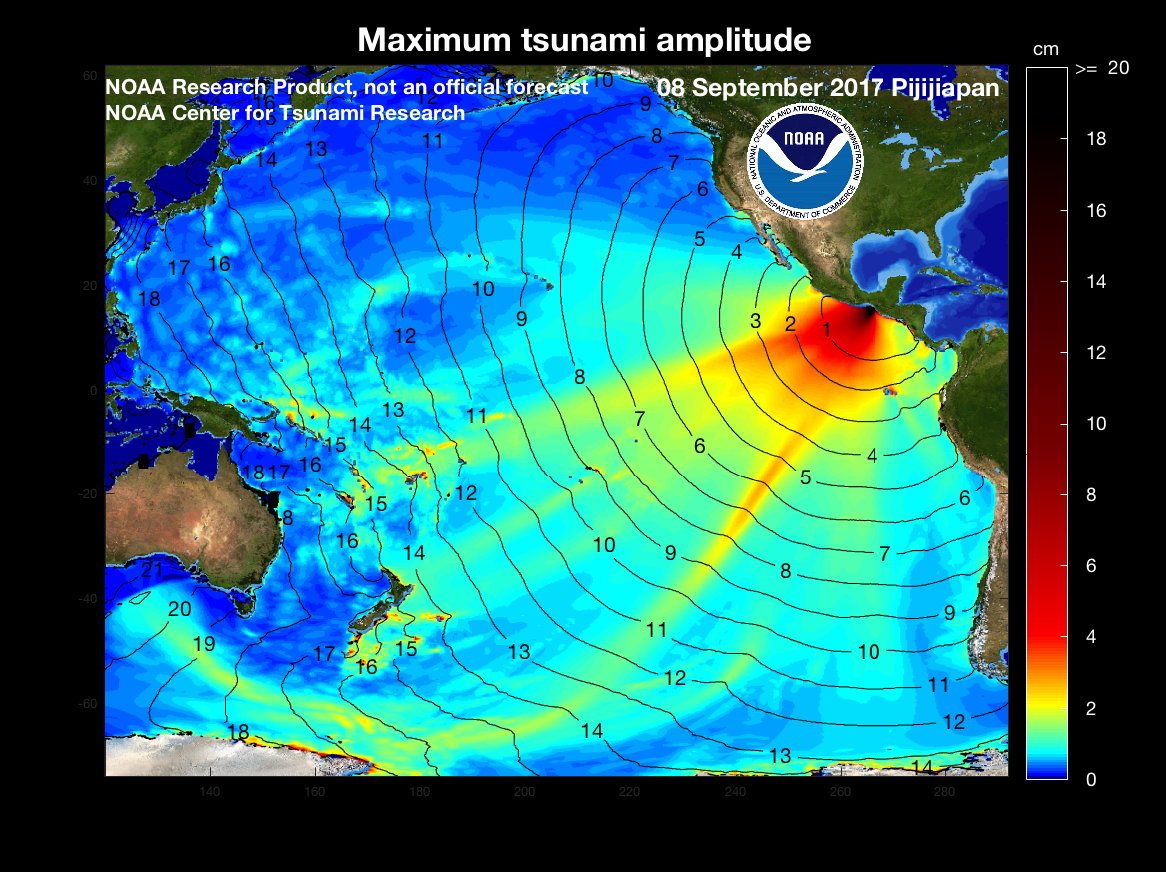
The Pijijiapan, Mexico tsunami was generated by a Mw 8.1 earthquake (15.068°N 93.715°W), at 2017-09-08 04:49:21 UTC (according to the USGS). The first peak of tsunami was detected at the Salina Cruz tide gauge, Mexico, about 36 min after the earthquake. 27 min later, a tsunami peak of 8 cm was observed at DART 43413 located 840 km southwest from the epicenter. Model results shown below were created with the NOAA forecast method using MOST model with the tsunami source inferred from epicenter location and magnitude (Mw 8.1) of the earthquake. The graphics display preliminary modeling analysis, showing qualitative and quantitative information about the tsunami, including tsunami wave interaction with ocean floor bathymetric features, and neighboring coastlines. Tsunami model amplitude information is shown color-coded according to the scale bar.
|
||||
Preliminary model and DART® buoy data/ tide gauge sea level data comparisons
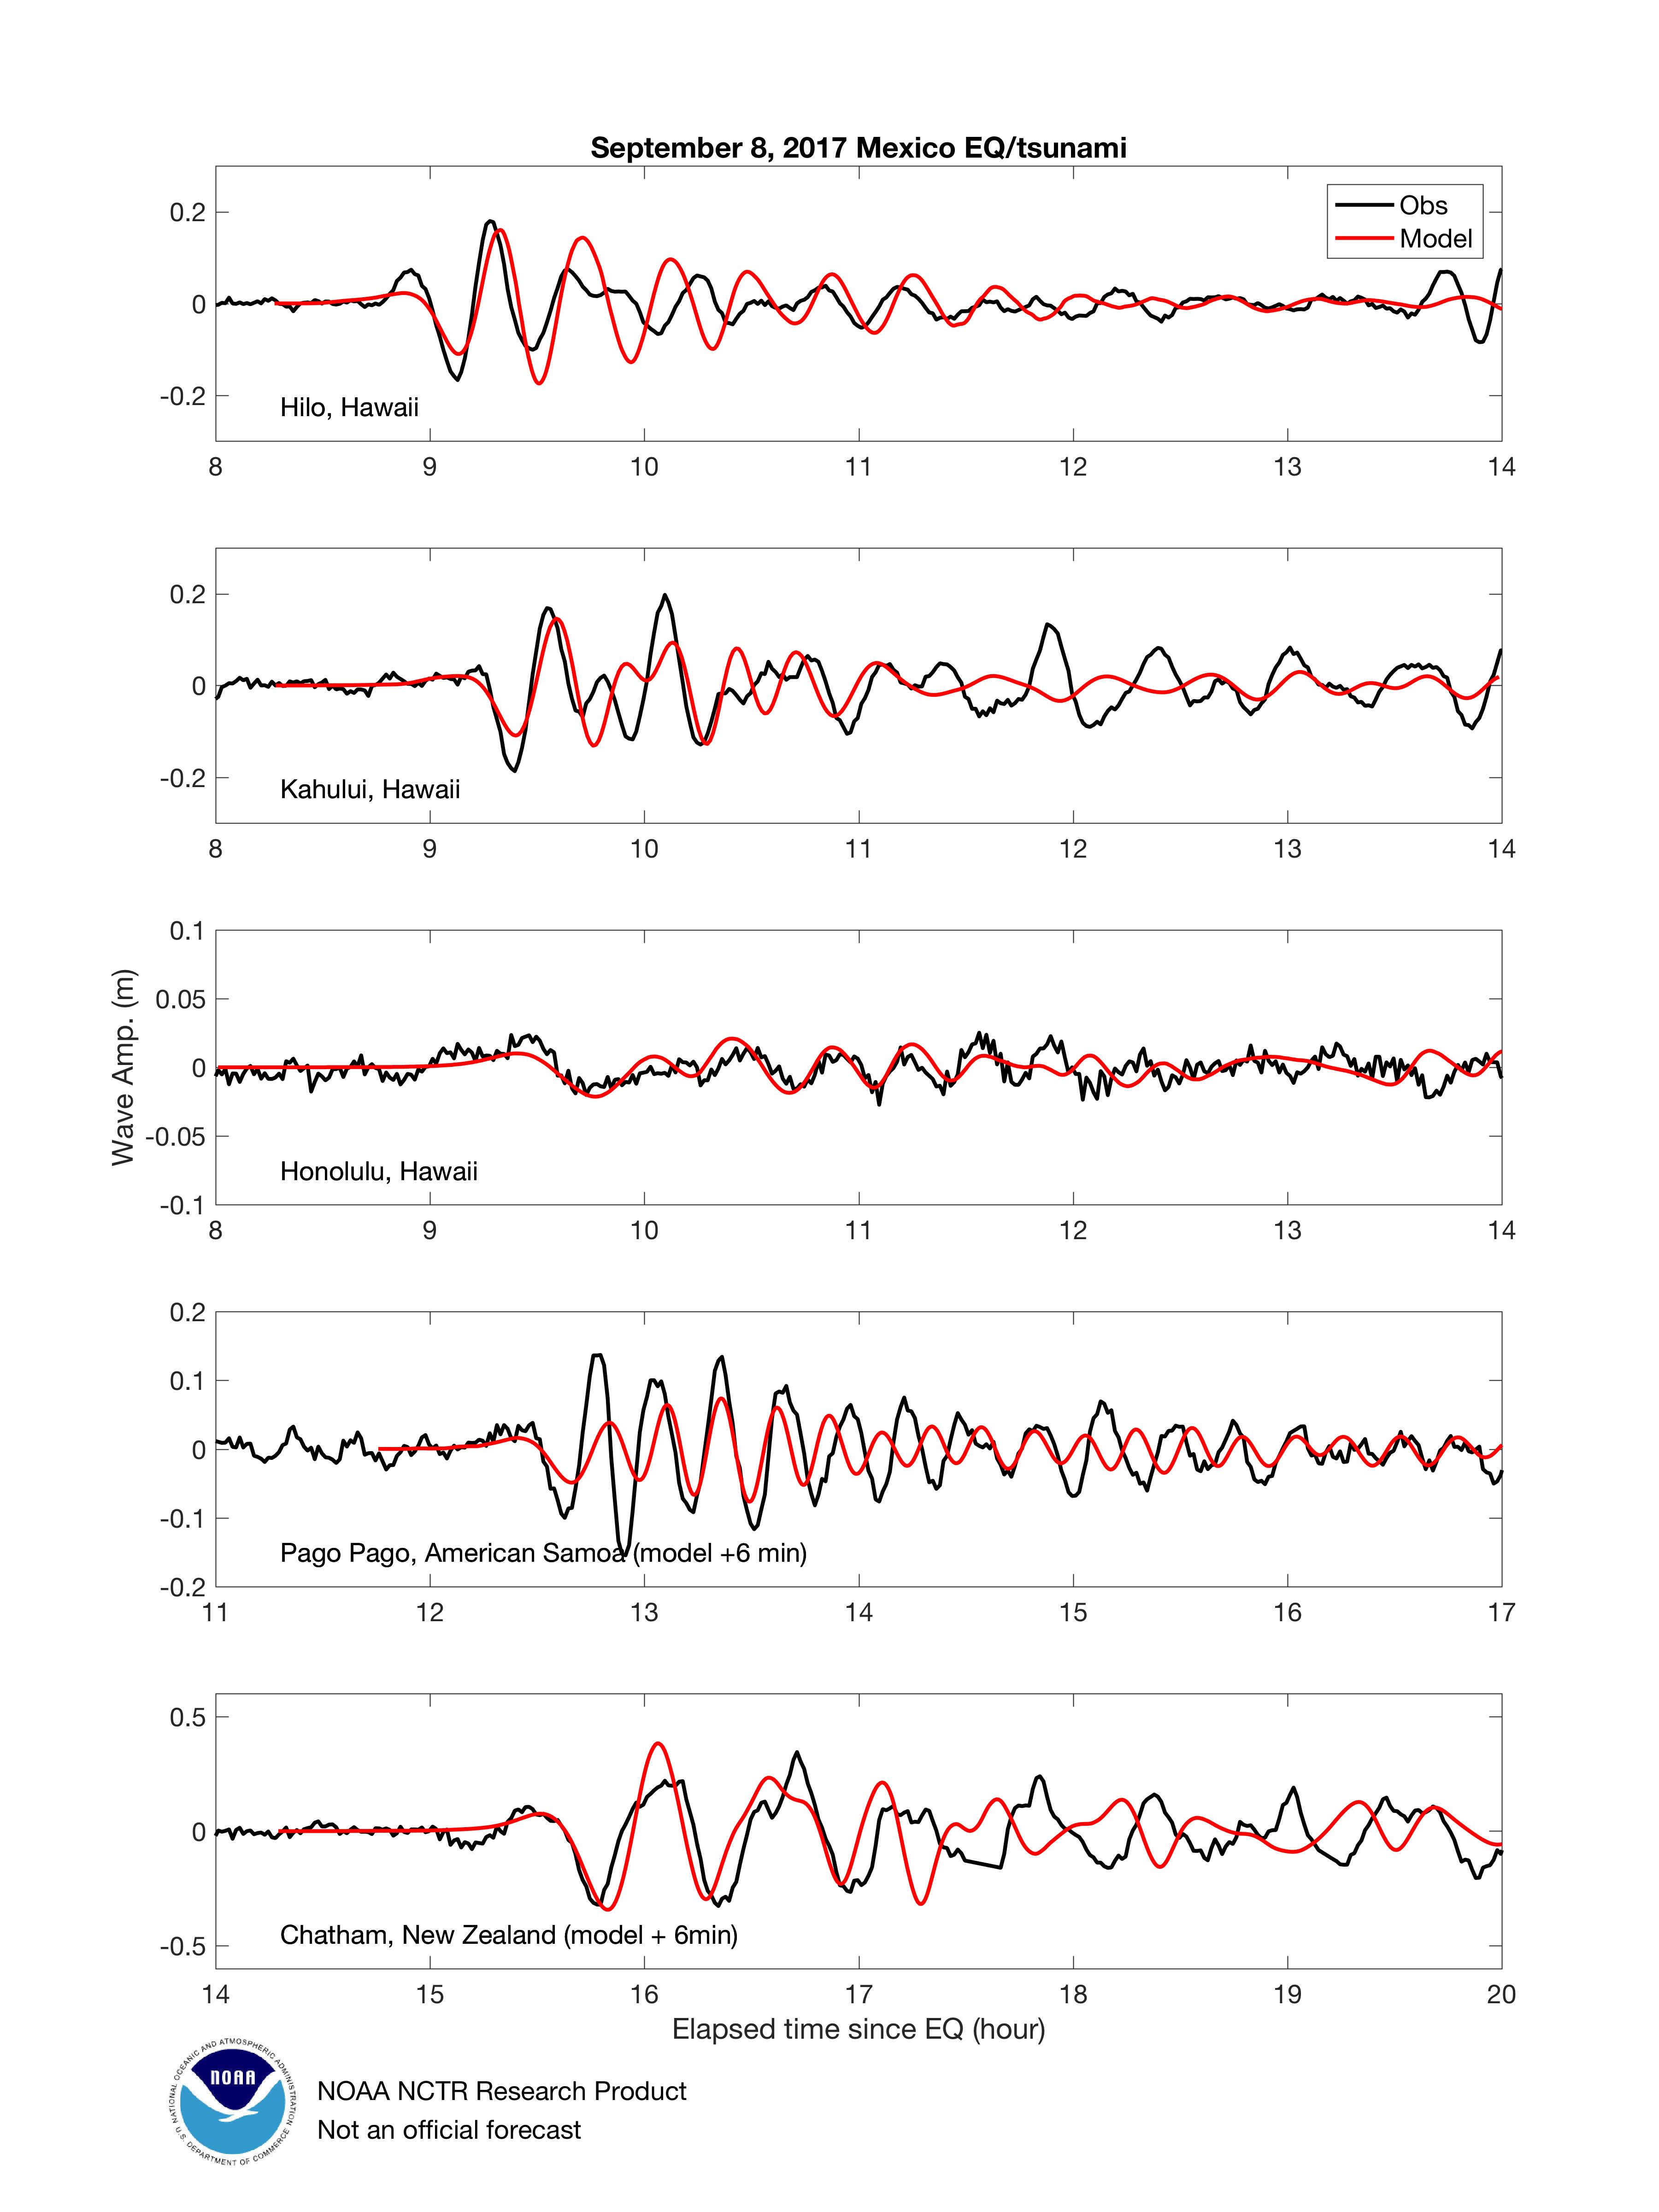
Comparison of the September 8, 2017 Pijijiapan, Mexico tsunami recorded at tsunameter/DARTs and tide gauges with model results. The DART model time series are obtained from the pre-computed generation/propagation forecast database after fitting models to tsunami records from the DARTs.
- DART® comparisons with model data
- Composite plot: DARTs 43413, 32411, and 32413
- Tide gauge comparisons with model data
- Composite plot: Salina Cruz, Puerto Angel, Huatulco, Mexico; Acajutla, El Salvado; Ayora and Baltra of Galapagos
- Composite plot: Hilo, Kahului, Honolulu, Hawaii; Pago Pago, American Samoa; and Chatham, New Zealand
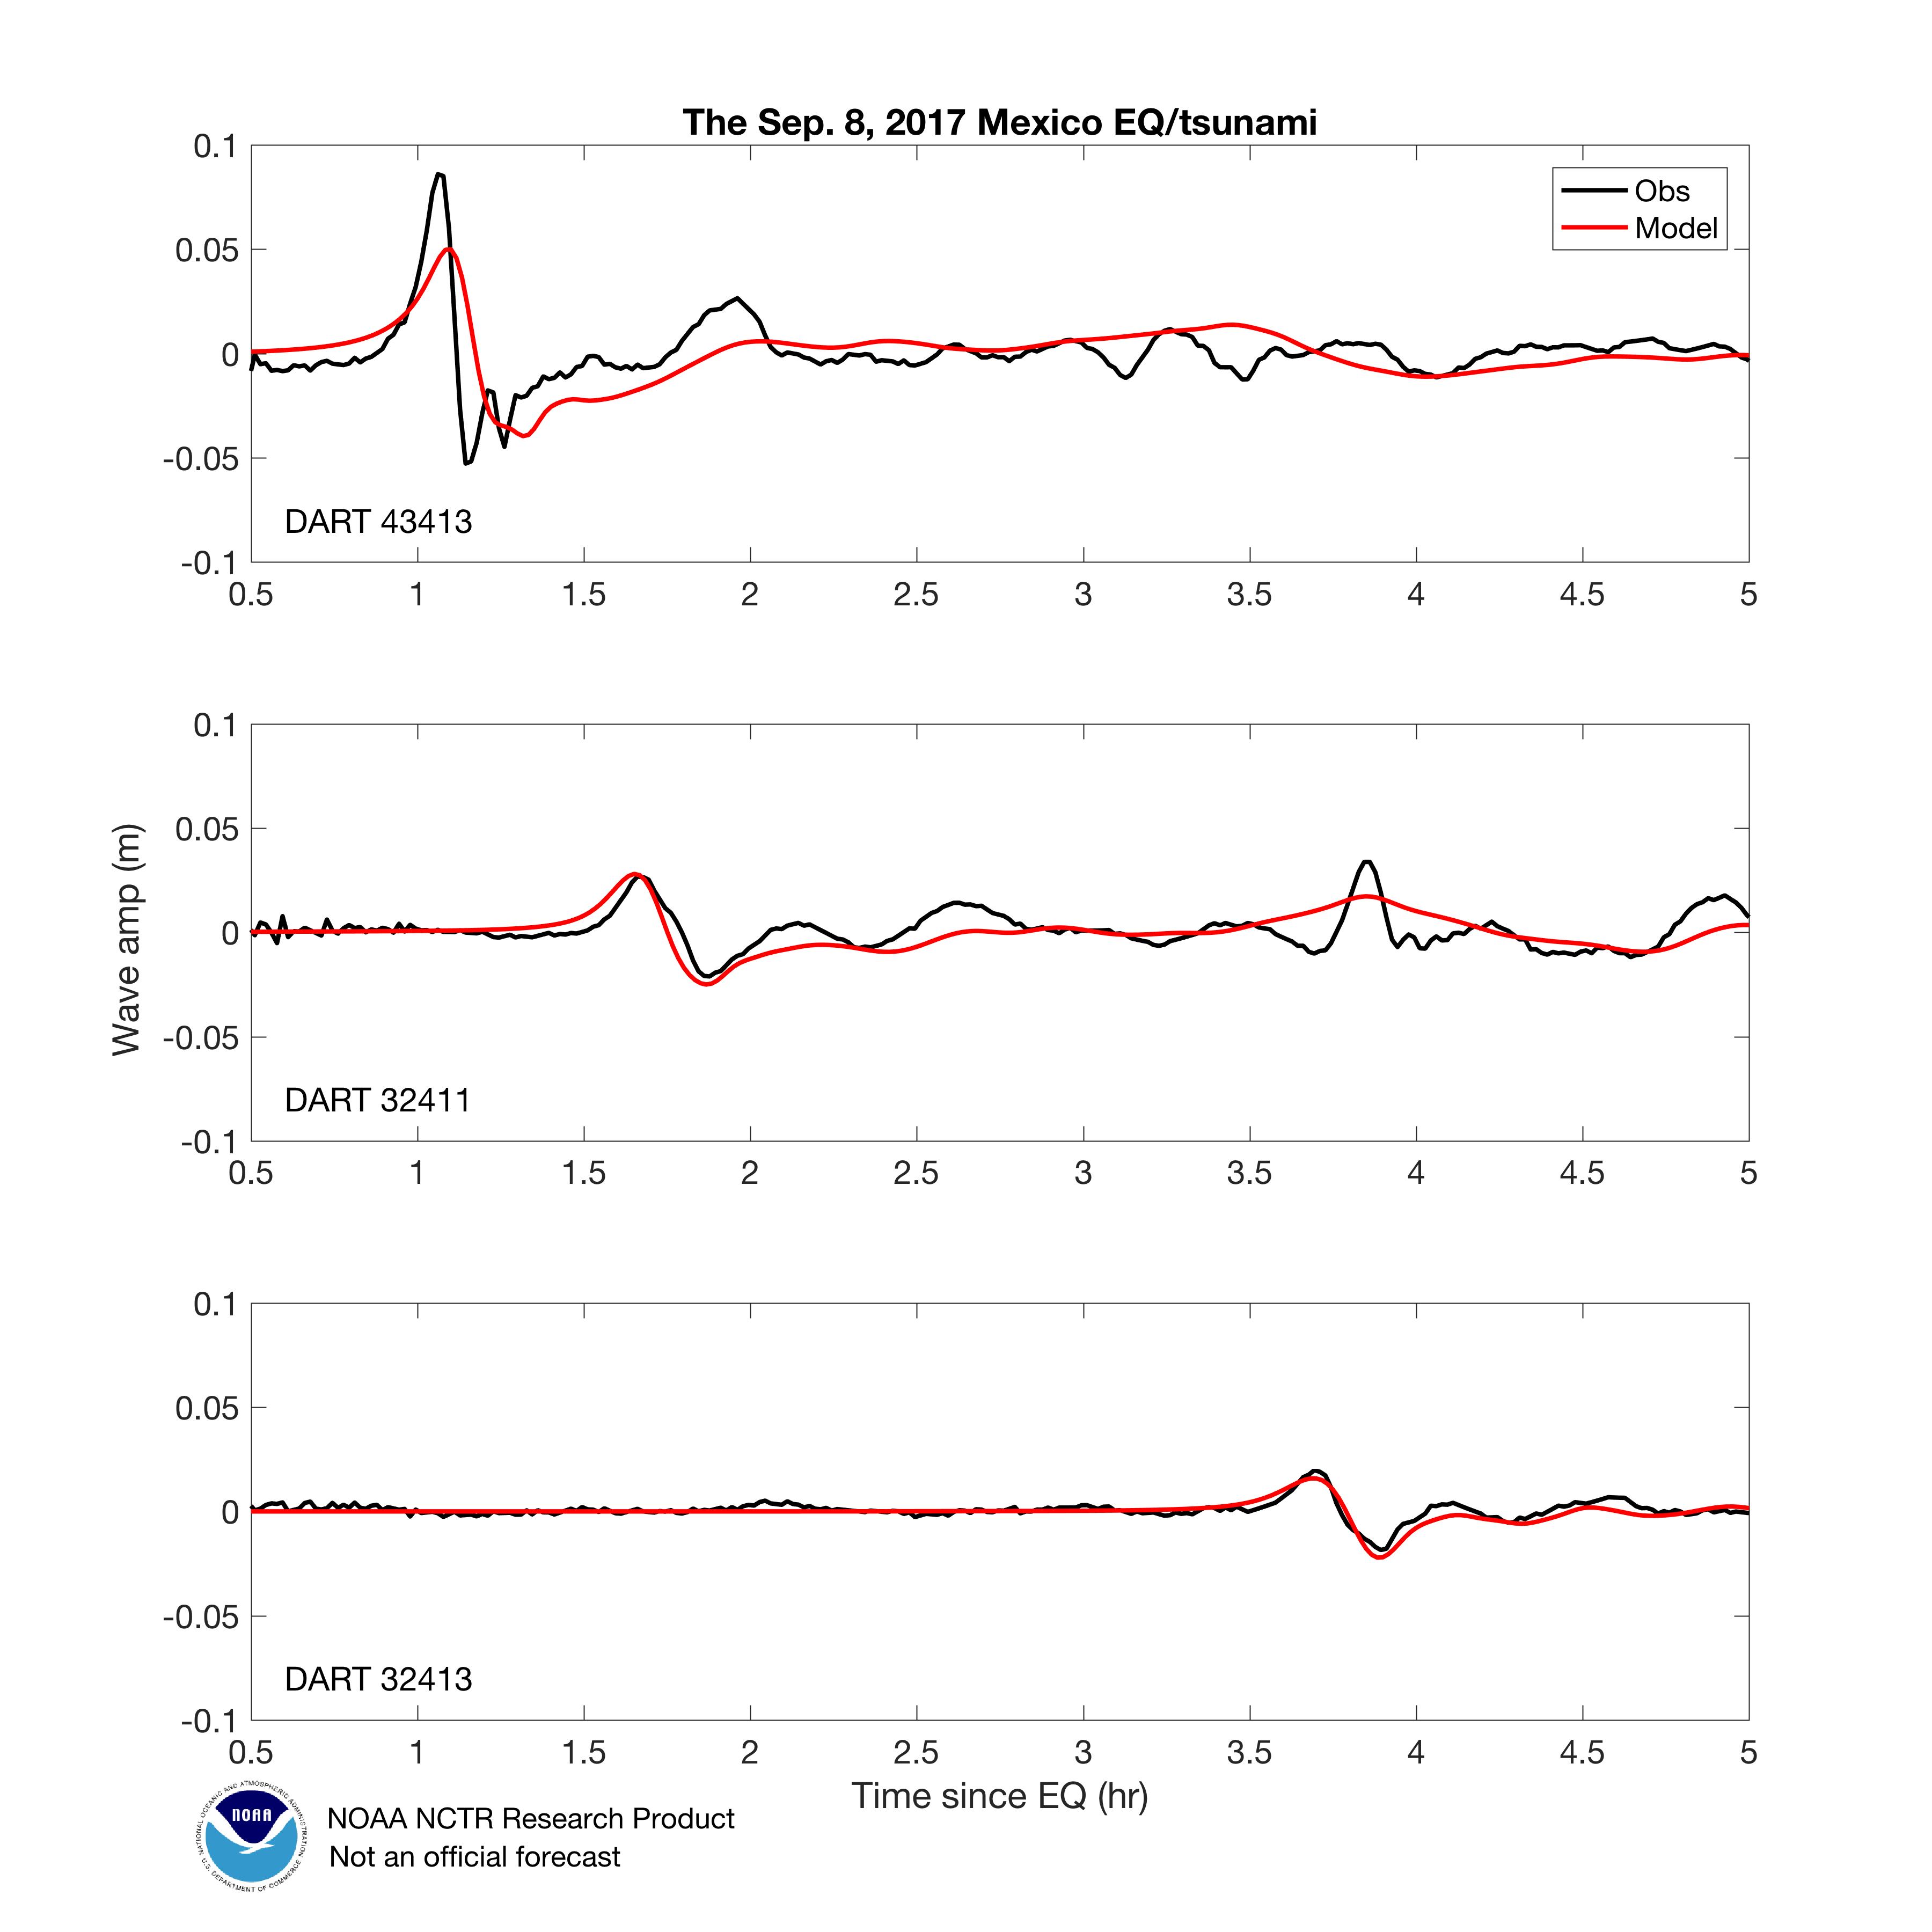
DART® comparisons with model data
Click to see large image
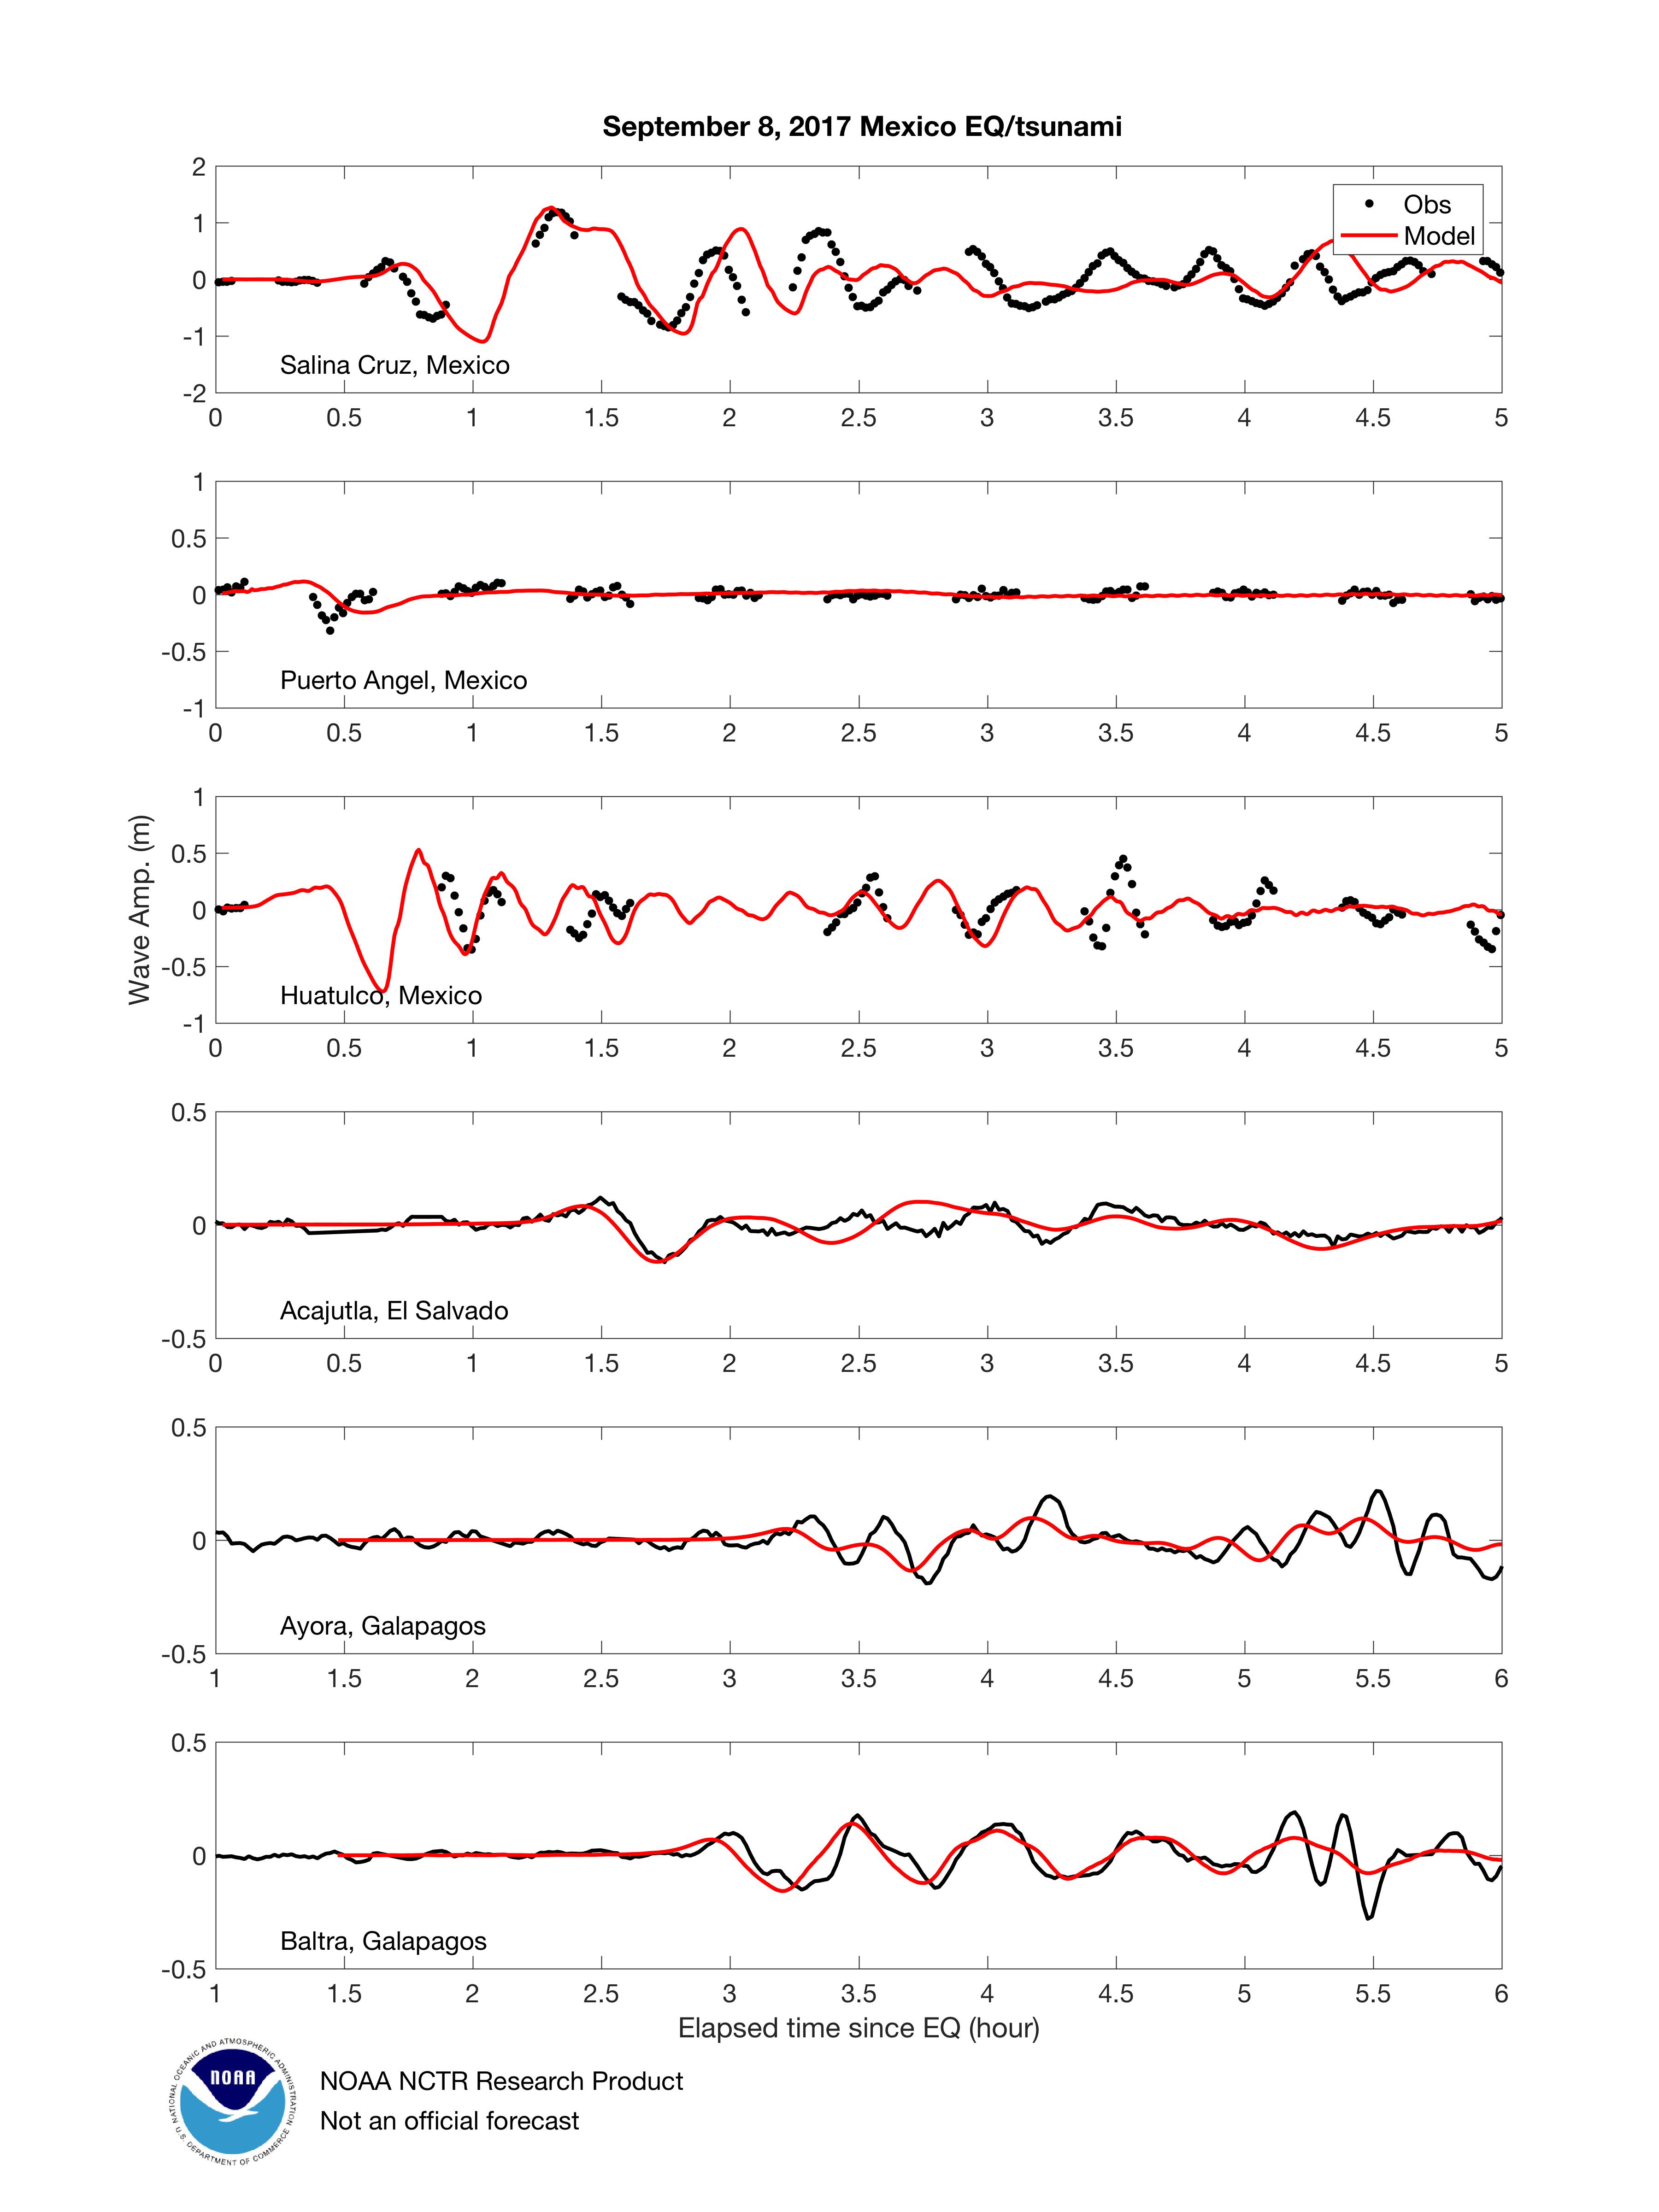
Tide gauge comparisons with model data
Click to see large image
Tide gauge comparisons with model data
Click to see large image
It is noted that all above model results are preliminary at this point. The tsunami source is estimated from inversion of observed waveforms at DARTs using high-angle normal-fault unit sources. The discrepancies between model results and tide gauge observation are mostly due to our limited knowledge of the earthquake/tsunami source configuration at this point, as well as lack of accurate bathymetry at some of the tide gauge locations.
Disclaimer: The models on these pages show the results of ongoing research to enhance tsunami science and to improve NOAA operational tsunami forecasts. These products were developed during or shortly after the tsunami event, are intended for research use, and are not an official forecast. They should not be used as the basis of any public or private policy decisions. Please contact NCTR to find if there are more detailed follow-on analysis results.
For media inquiries:
When using information from this page, please credit NOAA / PMEL / Center for Tsunami Research