Not an official forecast
Tsunami Event - September 29, 2009 Samoa
Main Event Page
Model Data Comparison Plots | Local American Samoa Modeling Results | Web Link Compilation | Field Survey Photos
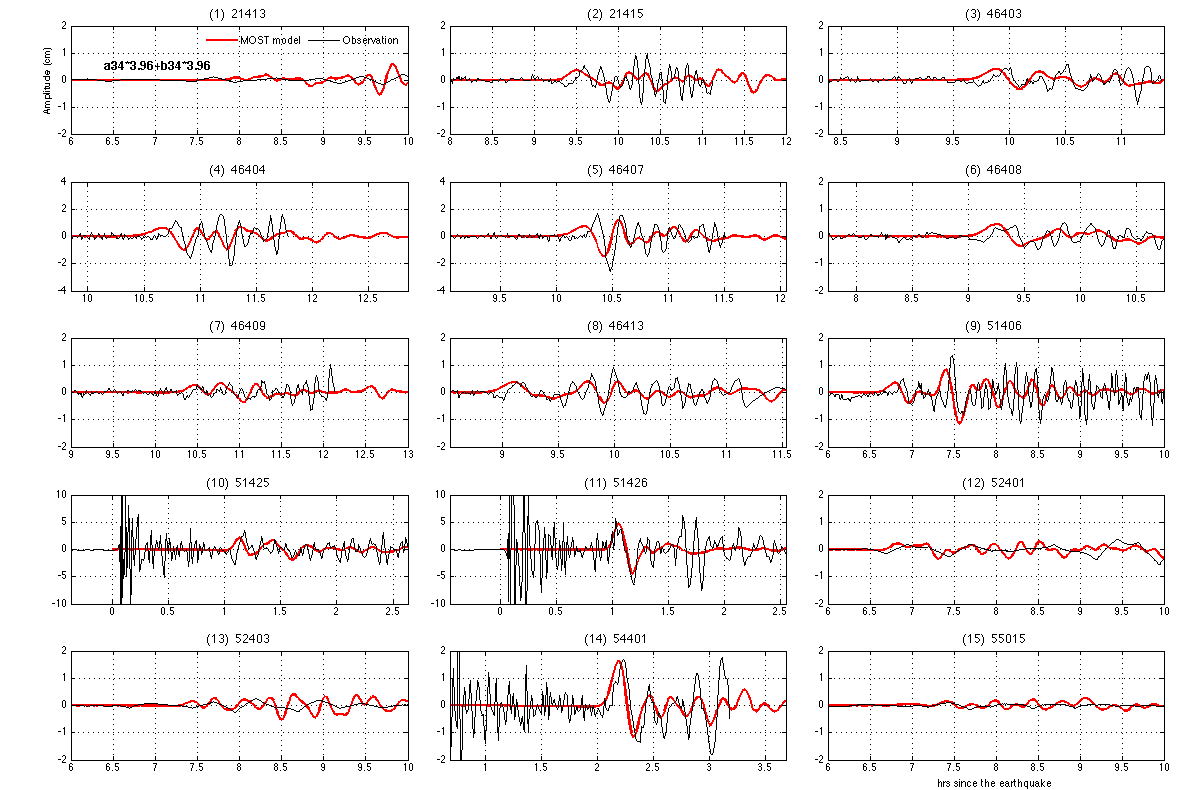
The Samoa tsunami was generated by a Mw 8.1 earthquake (15.509˚S, 172.034˚W ), at 17:48:10 UTC, 195 km (125 miles) south of Apia, Samoa (according to the USGS). In approximately an hour, the tsunami was recorded at DART® buoys 51425 and 51426. Forecast results shown below were created in real time (during the tsunami propagation) with the NOAA forecast method using MOST model with the tsunami source inferred from DART® data.
The graphics to the left display forecast results, showing qualitative and quantitative information about the tsunami, including tsunami wave interaction with ocean floor bathymetric features, and neighboring coastlines. Tsunami model amplitude information is shown color-coded on top of blue-shaded sea floor bathymetry.
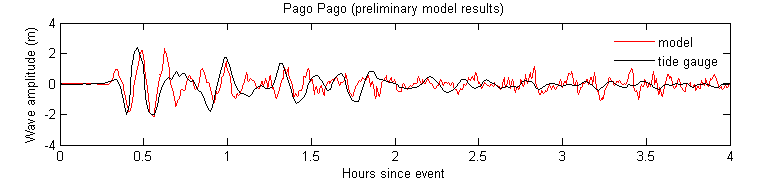
The tsunami waves first arrived at Pago Pago, American Samoa, (approximately 250 km from earthquake epicenter) earlier than other tide gages, at 18:08 UTC, about 20 minutes after the earthquake.
Model and DART® buoy data / tide gage data comparison
- New! Interactive map with Model - Sea Level data comparisons
- Composite plots by region: DART® buoy comparisons with model results | Hawaii | US West Coast | Pago Pago
- Unit Sources: 3.96*nt34a+3.96*nt34b
- New! Tsunami propagation animation with max wave amplitude (11 MB)
- New! Field Survey photos
- Local American Samoa Modeling Results
- Web Link Compilation
- Slideshow text alternative
For media inquiries:
When using information from this page, please credit NOAA / PMEL / Center for Tsunami Research