Tsunami Event - September 29, 2009 Samoa
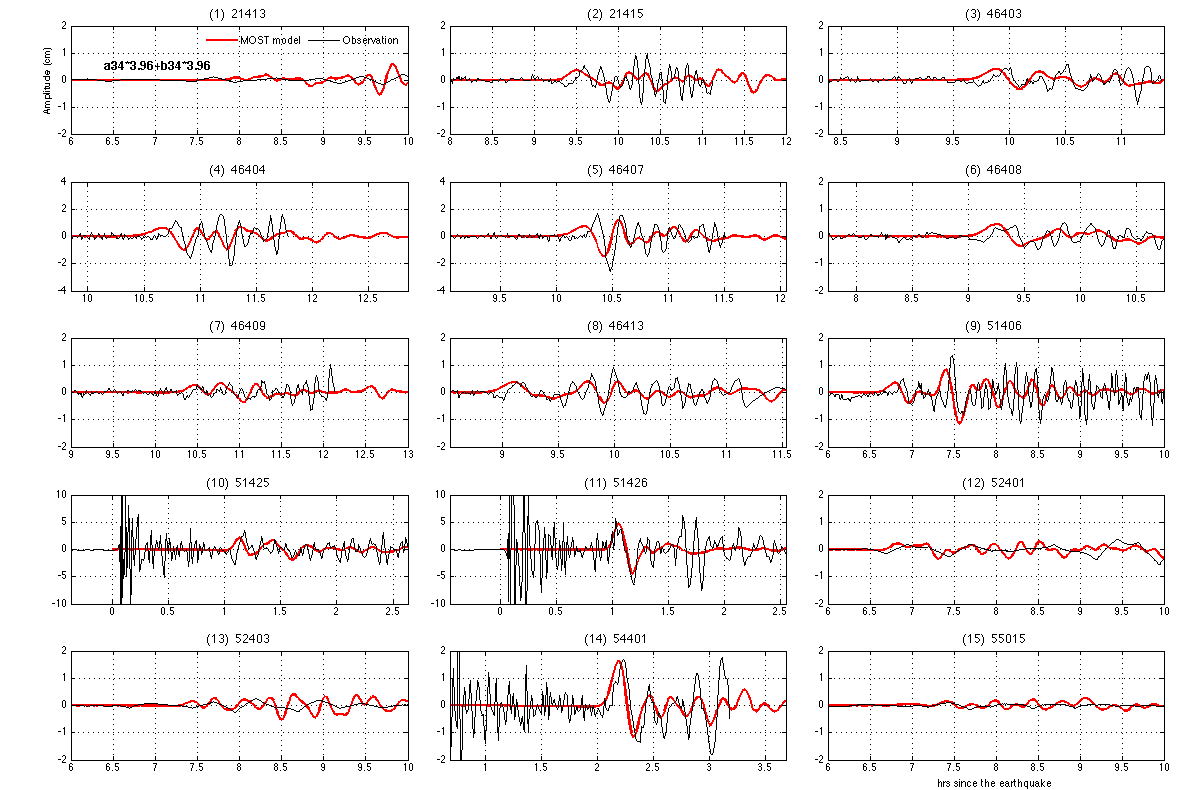
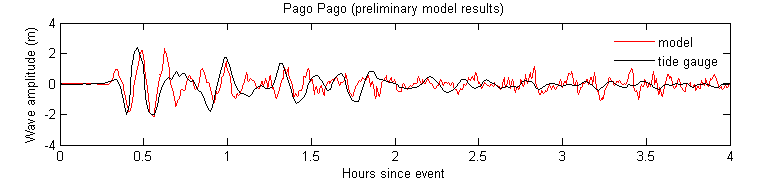
Model and Data Comparison Plots
Samoa Tsunami Event Page | Local American Samoa Modeling Results | Web Link Compilation | Field Survey Photos
Model and DART® buoy data / tide gauge data comparison: composite plots by region
Disclaimer: The forecasts on these pages show the results of ongoing research to enhance tsunami science and to improve NOAA operational tsunami forecasts. These products were developed during or shortly after the tsunami event, are intended for research use, and are not an official forecast. They should not be used as the basis of any public or private policy decisions. Please contact NCTR to find if there are more detailed follow-on analysis results.
Click to see NCTR metadata.
See also
For media inquiries:
When using information from this page, please credit NOAA / PMEL / Center for Tsunami Research