Not an official forecast
Sulawesi Tsunami, September 28, 2018
Main Event Page
|
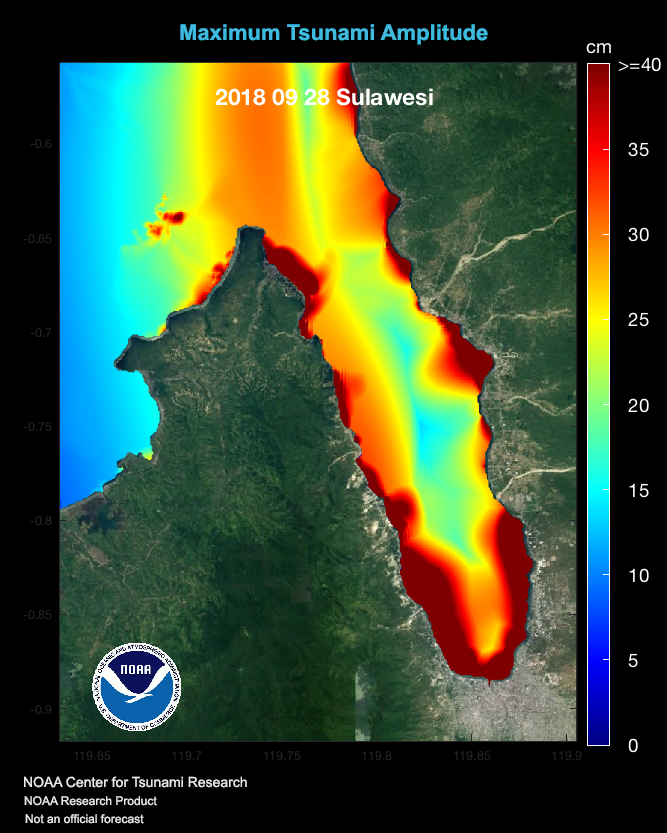
The Palu tsunami was generated by a Mw7.5 earthquake that occurred on September 28, 2018 at 10:02:43 (UTC) with the epicenter at 0.178°S 119.840°E, 78km North of Palu, Central Sulawesi, Indonesia. Tsunami and earthquake shaking have impacted all of Palu Bay from City of Palu at the very south of the bay to Donggala at the north entrance of the Bay. At least 1,948 people were killed, 835 are still missing with rescue operations still underway. The tsunami was recorded on at least two tide gages, one inside the Palu bay at port of Pantoloan with maximum amplitude of up to 2m, and at the Mamuju tide gage, over 200mi away from the bay with amplitudes of about 5-6cm. The data about tsunami observations, measurements and origin are still being assessed by multiple survey teams. Observations to date suggest a very complex tsunami event that may involve multiple sources of tsunami generation, including landslides, tectonic displacement and possibly others. The modeling assessment presented at this page should be considered as only part of the comprehensive analysis of this tsunami event that is currently underway. The model results are preliminary and are expected to be updated in the near future. The page will be updated when more information is available. The model results shown include only tsunami generation due to permanent deformation of the sea floor due to the earthquake rupture along the fault. This model produces tsunami amplitudes that are consistent with the observed tide gage records. Other phenomena associated with the earthquake, such as a submarine landslides, may have also contributed to high tsunami wave elevations in Palu reported by survey teams but not quite captured in the model. The simulation was created with the NOAA forecast method using MOST model with the tsunami source inferred from CMT and the Final Fault solution from USGS assessment of the earthquake)
|
||||
Preliminary Model
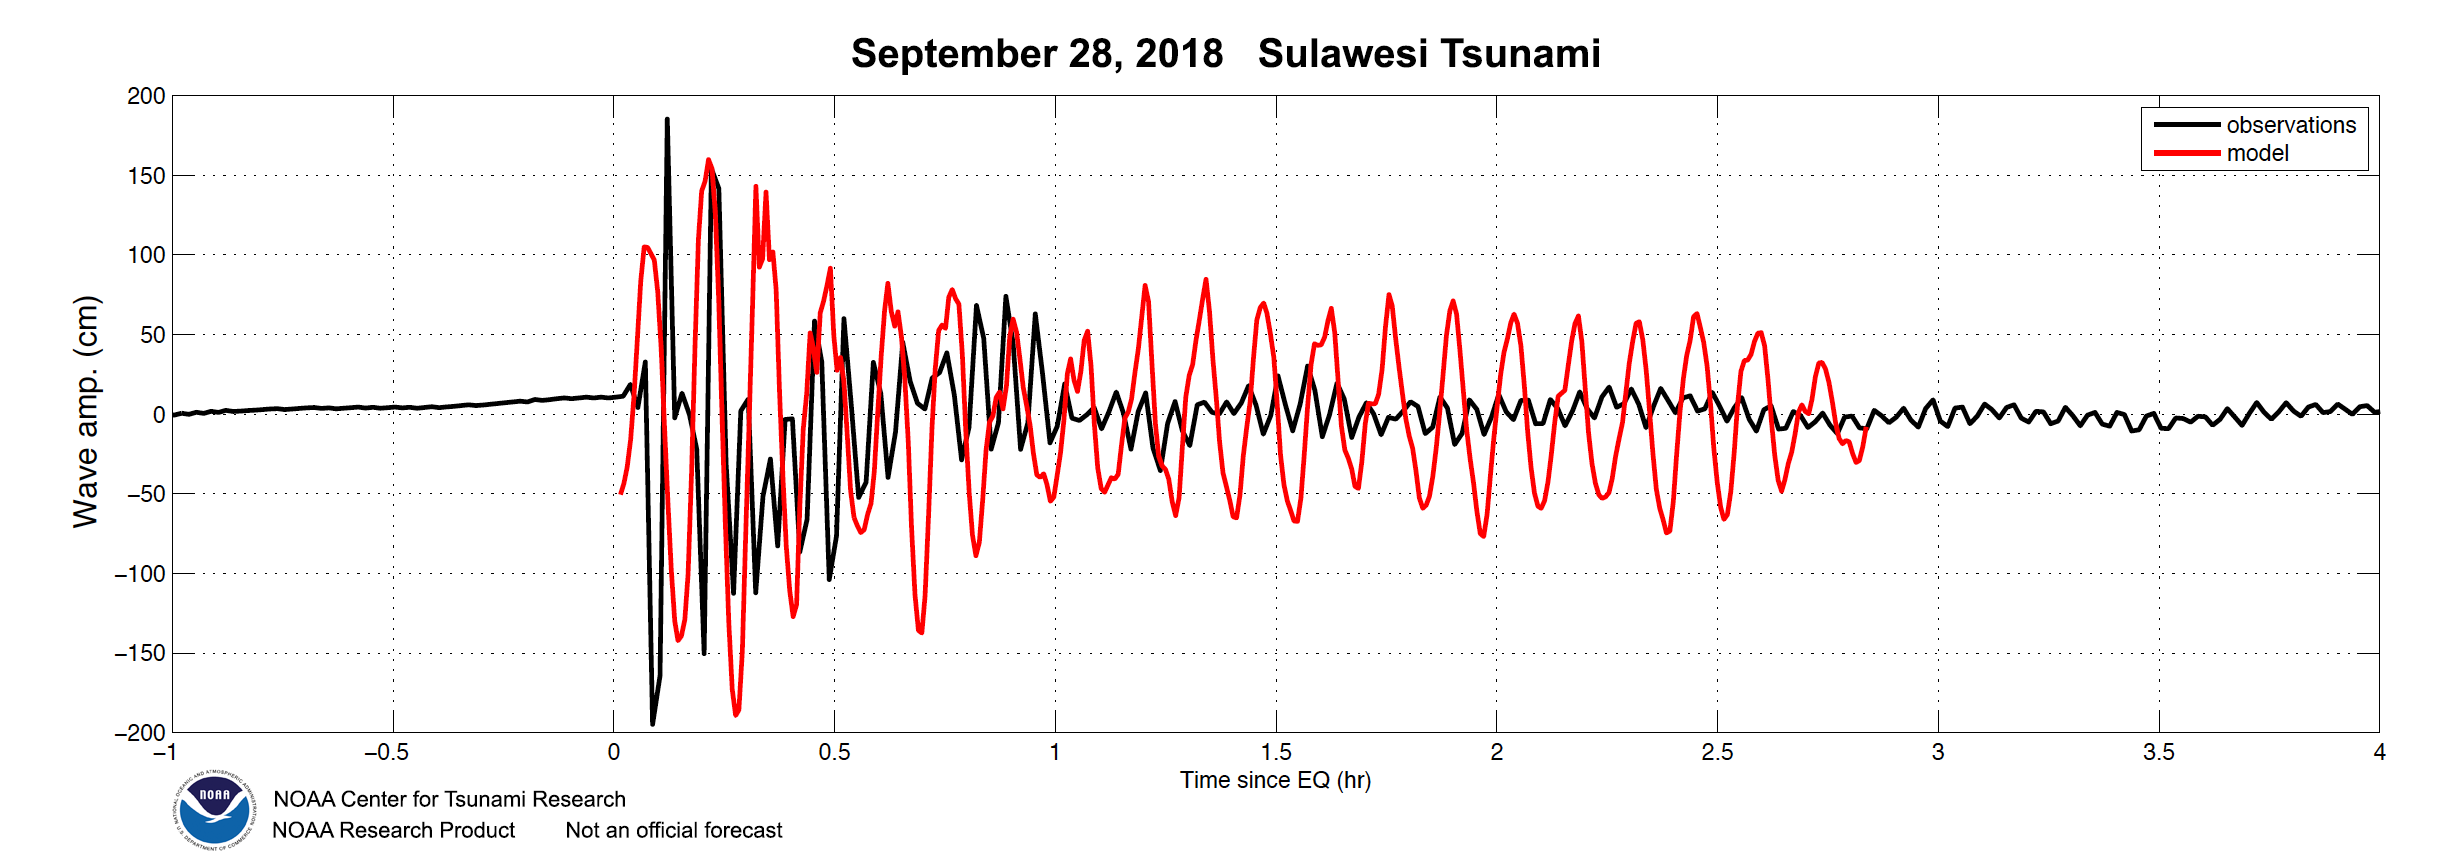
- Comparisons of the model time series at Pantoloan port at Palu Bay with measurements from the tide gage.
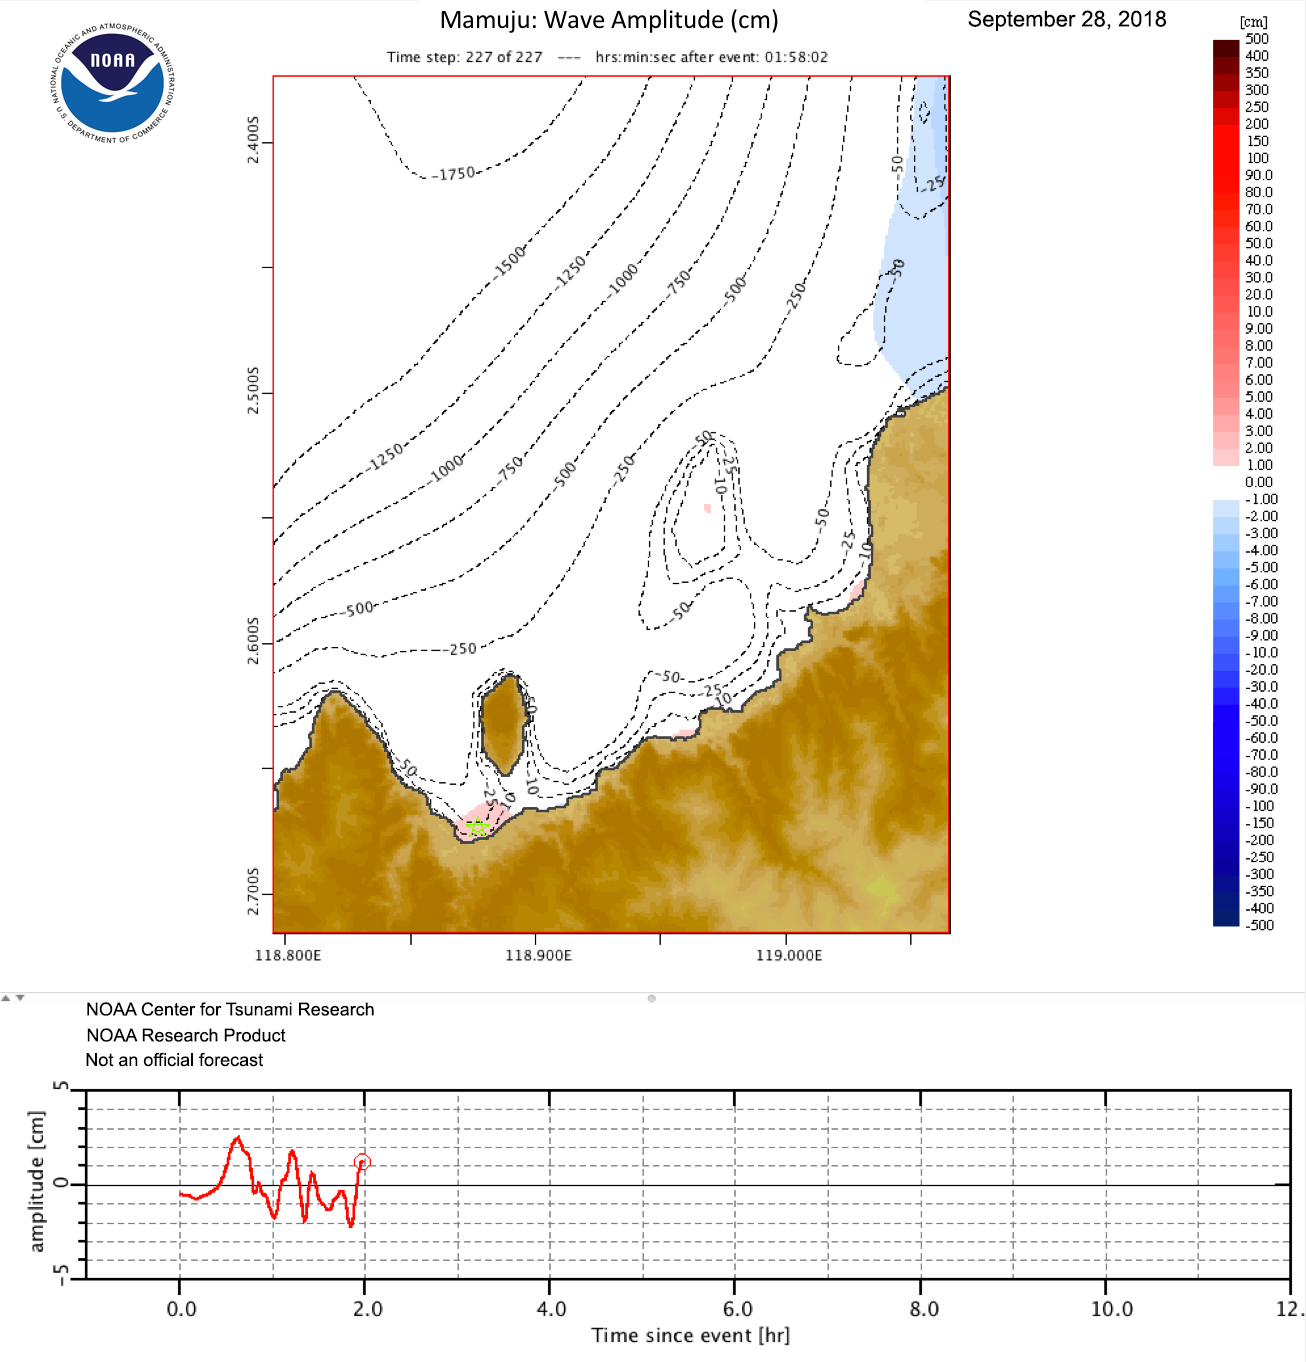
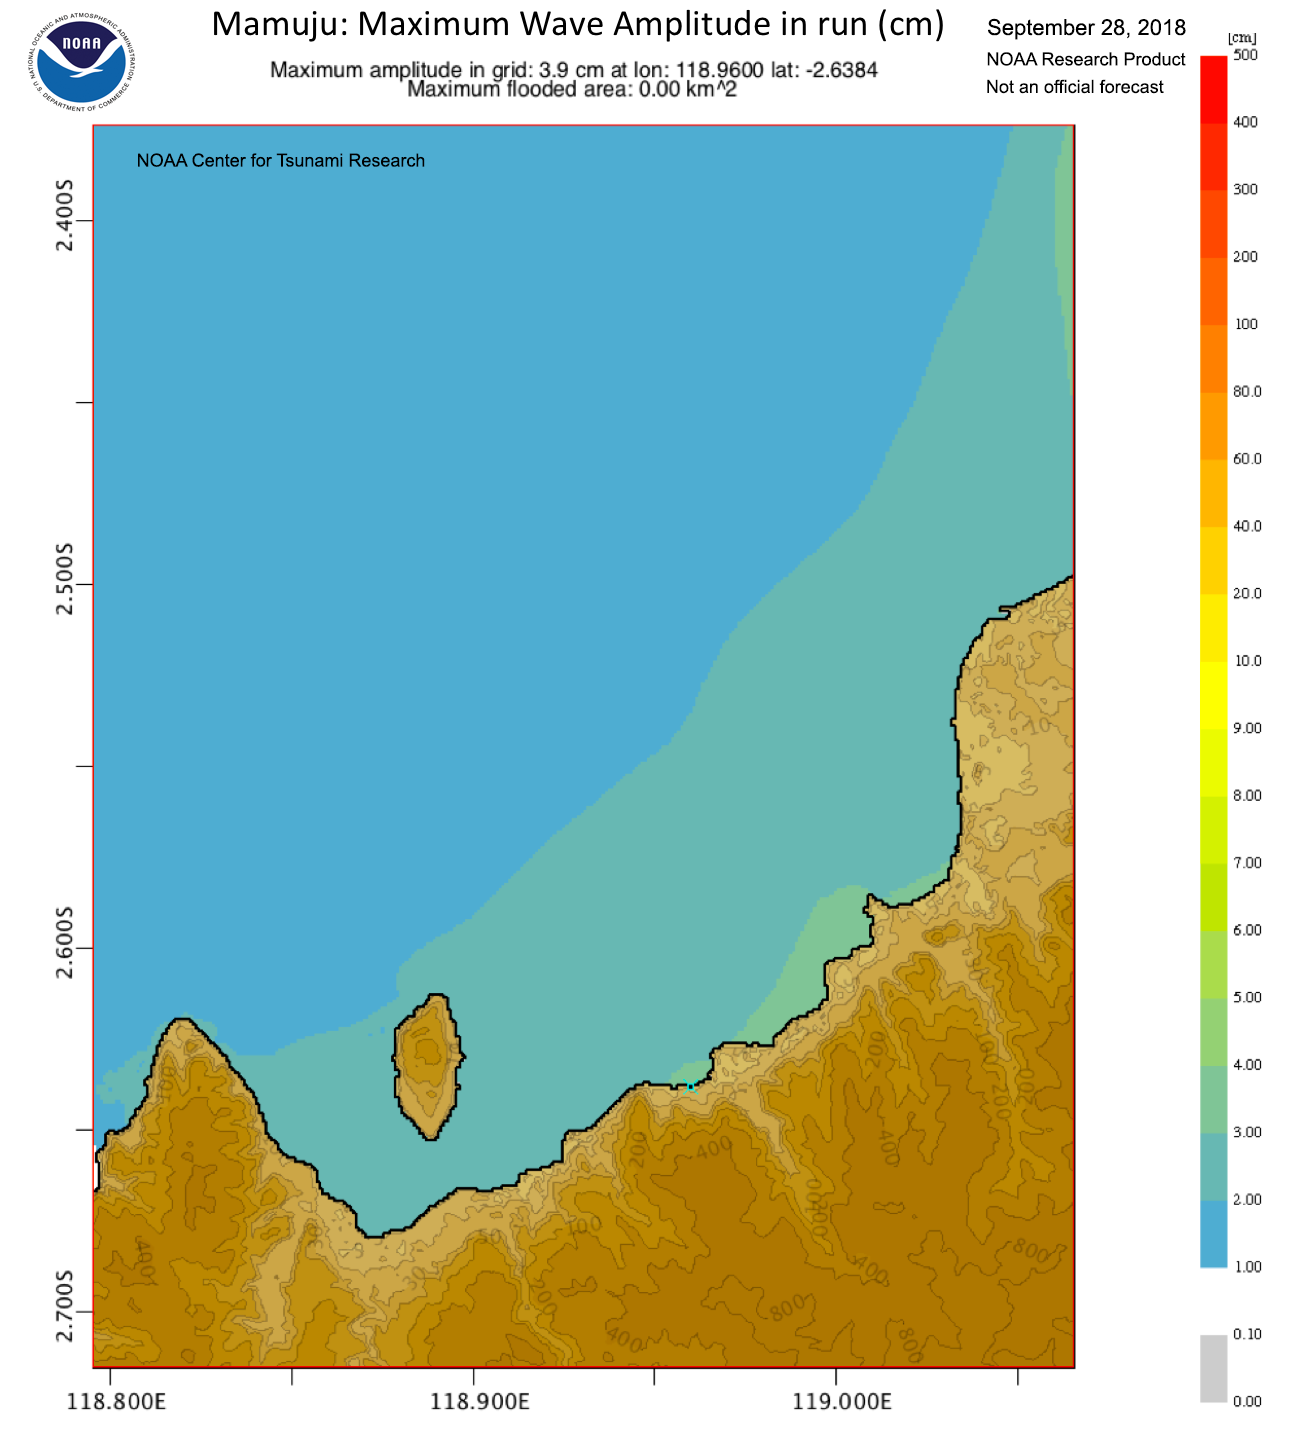
- Comparisons of the model time series at Mamuju with measurements from the tide gage (no digital data from Mamuju are available for one to one comparison).
Disclaimer: The models on these pages show the results of ongoing research to enhance tsunami science and to improve NOAA operational tsunami forecasts. These products were developed during or shortly after the tsunami event, are intended for research use, and are not an official forecast. They should not be used as the basis of any public or private policy decisions. Please contact NCTR to find if there are more detailed follow-on analysis results.
For media inquiries:
When using information from this page, please credit NOAA / PMEL / Center for Tsunami Research