Not an official forecast
Tsunami Event - August 15, 2007 Peru
Main Event Page
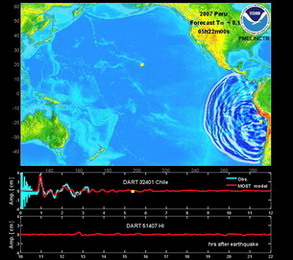
The Peru tsunami was generated by a Mw 8.0 earthquake (13.380°S 76.610°W), 2007-08-15 23:40:57 UTC (according to the USGS).
Animations of the August 15, 2007 Peru tsunami propagation created with research runs of the MOST tsunami forecast model and including DART® buoy data. Yellow squares indicate DART® buoy locations. Click the image to animate (left) or enlarge (right).
 |
 |
Propagation in the Pacific Ocean (40.5 MB animation). Click to animate. |
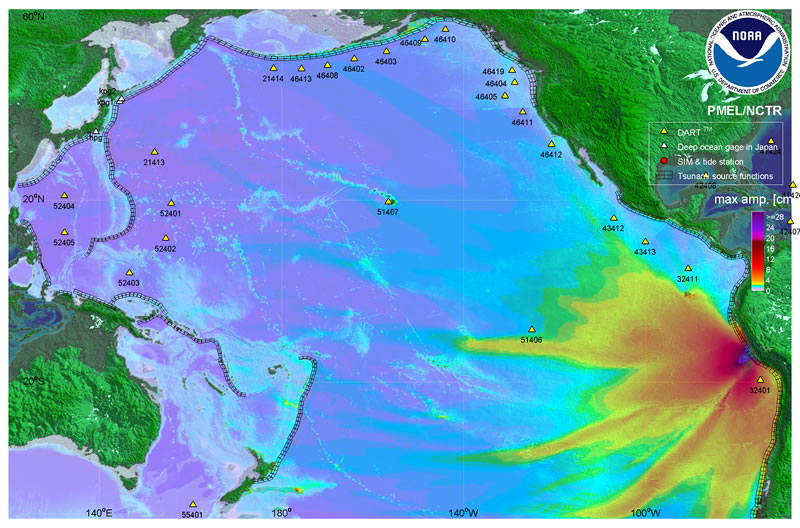
Maximum wave amplitude distribution (image). Click to see larger image. |
The animation and graphic display qualitative and quantitative information about the tsunami propagation including tsunami wave interaction with ocean floor bathymetric features, and neighboring coastlines. The tsunami radiation pattern is indicated with color coded information about the maximum wave amplitude at different locations throughout the Pacific Ocean.
The timer and moving yellow squares indicate time elapsed since time of the earthquake, providing an estimate of tsunami arrival time at different locations (left).
Unit Sources: 0.9*a61 + 1.25*b61 + 5.6*a62 + 6.97*b62 + 3.5*z62
Links
- Sea level data and graphs from the Peru tsunami - from the West Coast/Alaska Tsunami Warning Center.
- Some photos taken in the La Punta district of Callao, near Lima, 4 hours after the earthquake (ftp) - from Natural Hazards Group, GNS Science - Te Pu Ao, Lower Hutt, New Xealand
- Information page from Tsunami Research Center, Department of Civil and Environmental Engineering, University of Southern California
- NGDC Peru Event page - from NGDC
- "EERI reconnaissance team report evidence of a tsunami of approximately 2.5 - 3 meters impacting ports of Pisco and Paracas. Fishing boats were carried inland a considerable distance" - from Susan Tubbesing, Earthquake Engineering Research Institute (EERI)
For media inquiries:
When using information from this page, please credit NOAA / PMEL / Center for Tsunami Research