Not an official forecast
Kuril Islands Tsunami, March 25, 2020
Main Event Page
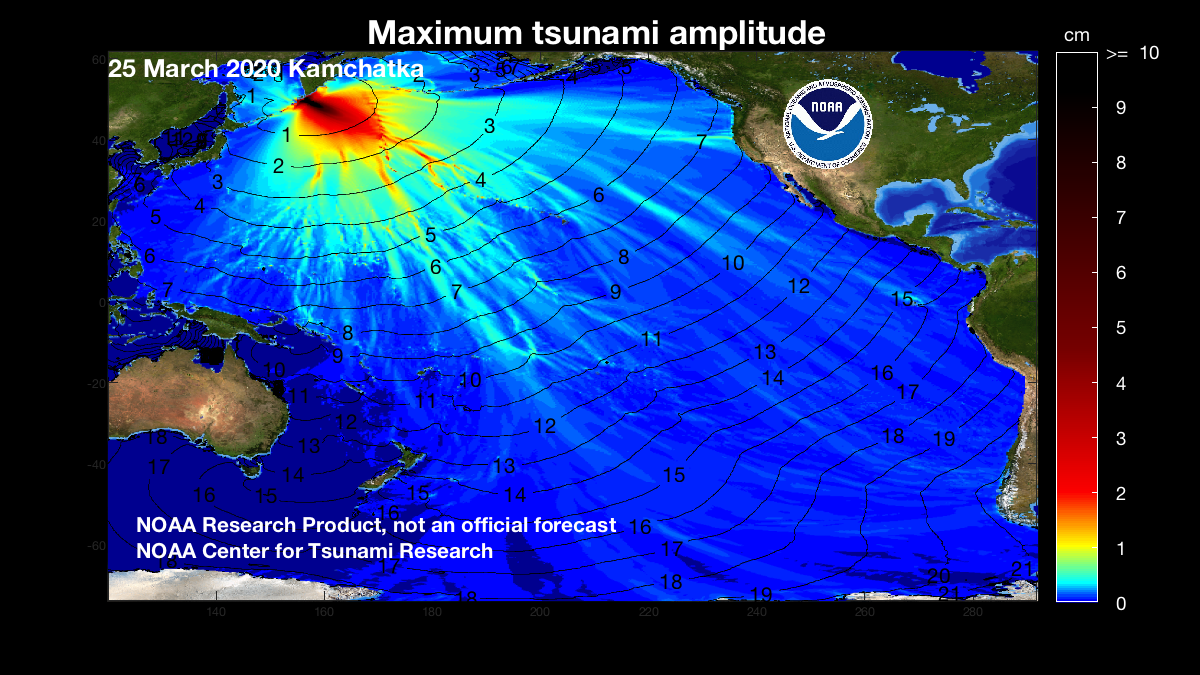
The March 2020, Kuril Islands tsunami was generated by a Mw 7.5 earthquake (48.986°N 157.693°E), at 2020-03-25 02:49:21 UTC (according to the USGS). The first and largest peak of the tsunami waveform was detected at DART 21416 located 426 km southeast of the epicenter, approximately 30 minutes after the earthquake with a maximum wave amplitude of just over 3 cm (Note: DART 21402, the closest station to the source was inactive during this event). Model results shown below were created with the NOAA forecast method using MOST model via automatic inversion of the source with NOAA's TFS (Tsunami Forecast System).
The graphics display preliminary modeling analysis, showing qualitative and quantitative information about the tsunami, including tsunami wave interaction with ocean floor bathymetric features, and neighboring coastlines. Tsunami model amplitude information is shown color-coded according to the scale bar.
 Model amplitudes calculated with the MOST forecast model. Click to see large image. |
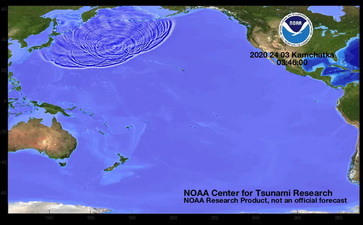 Propagation animation Click for animation. |
- Model amplitudes calculated with the MOST forecast model. Filled colors show maximum computed tsunami amplitude in cm during 24 hours of wave propagation.
-
 Propagation animation on YouTube
Preliminary model and DART® buoy data/tide gauge sea level data comparisons
Comparison of the March 25, 2020 Kuril Islands tsunami recorded at tsunameter/DARTs and tide gauges with model results. The DART model time series are obtained from the pre-computed generation/propagation forecast database in real time, after automatically fitting models to tsunami records from the DARTs.
- DART® comparisons with model data
- Composite plot: DARTs 21416, 214191, and 21415
- Tide gauge comparisons with model data
- Composite plot: Sand Island, UM; Wake Island, UM; Kahului, HI; Hilo, HI; Kawaihae, HI; Crescent City, CA
The model results shown are preliminary at this point. The presented best fitting of observed waveforms at the closest DART 21416 was obtained during real-time analysis using pre-computed solutions with thrust fault slightly offset from the source area. We are currently investigating other forecasts based on the USGS W-phase Centroid Moment Tensor solution.
The discrepancies between model results and tide gauge observation are mostly due to our limited knowledge of the earthquake/tsunami source configuration at this point.
Source: 0.736*ki09b
Disclaimer: The models on these pages show the results of ongoing research to enhance tsunami science and to improve NOAA operational tsunami forecasts. These products were developed during or shortly after the tsunami event, are intended for research use, and are not an official forecast. They should not be used as the basis of any public or private policy decisions. Please contact NCTR to find if there are more detailed follow-on analysis results.
For media inquiries:
When using information from this page, please credit NOAA / PMEL / Center for Tsunami Research