Not an official forecast
Japan (East Coast of Honshu) Tsunami, October 25, 2013
Main Event Page
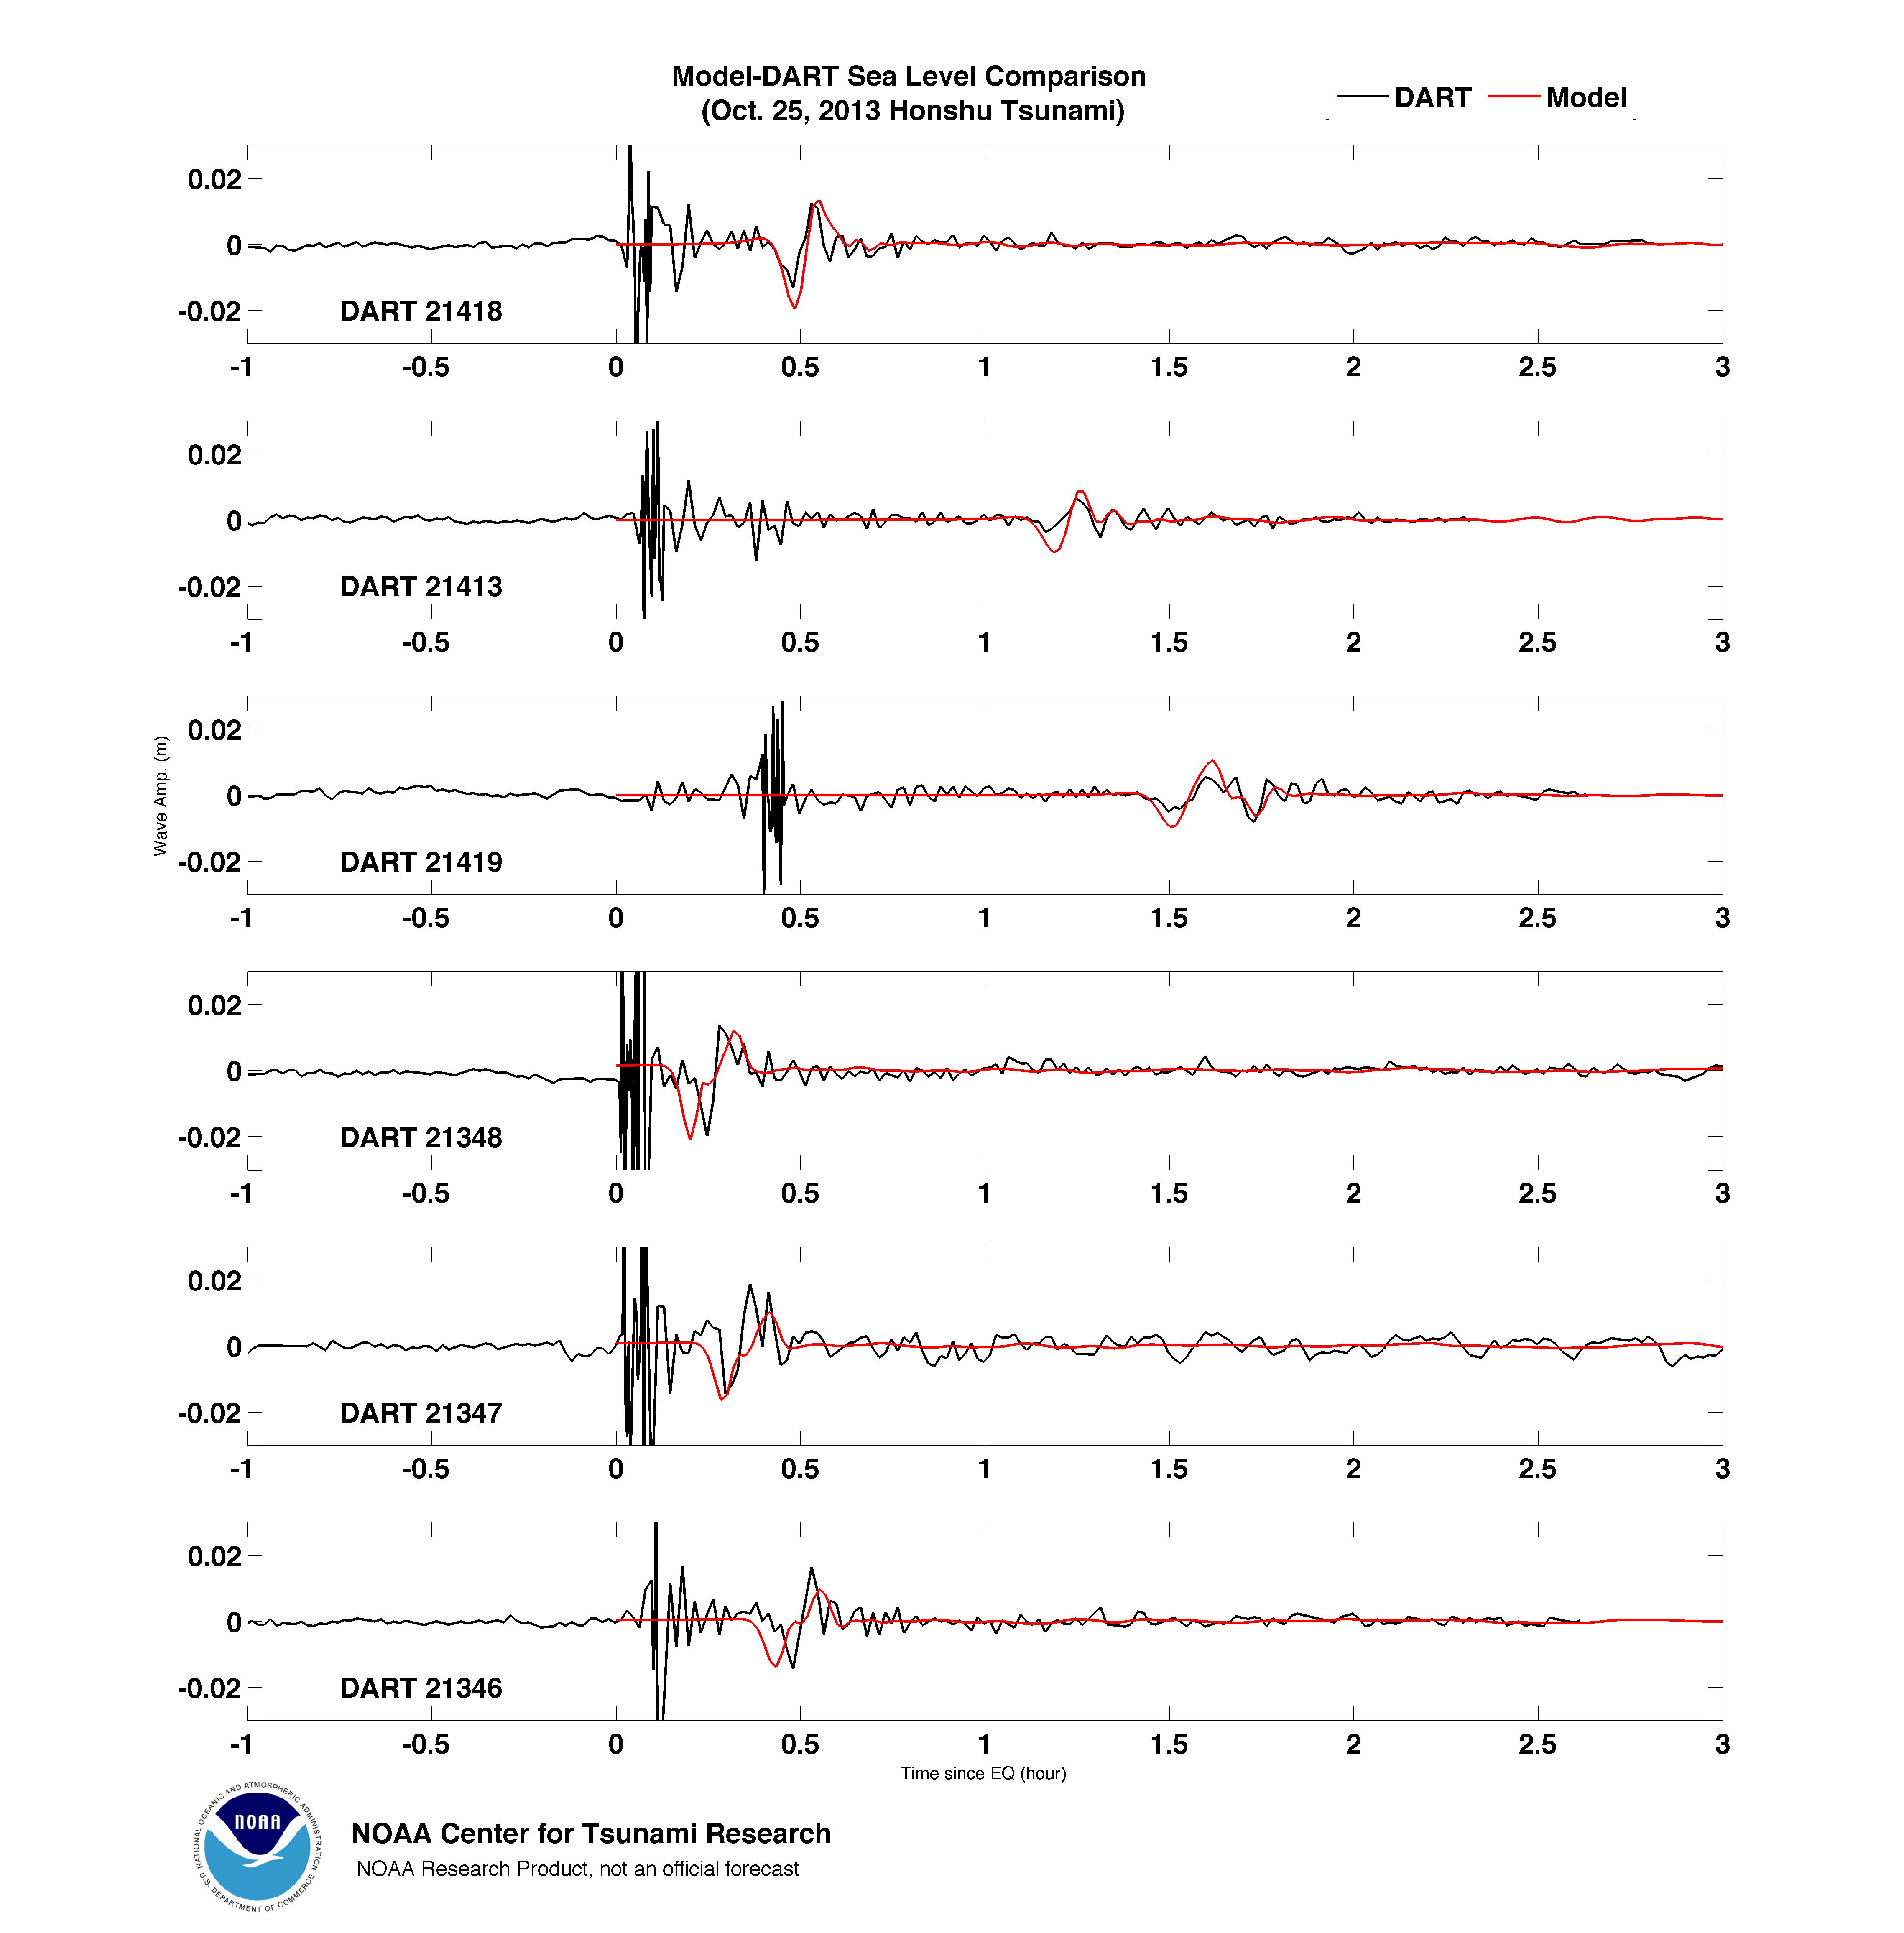
The Honshu, Japan tsunami was generated by a Mw 7.1 earthquake (37.156°N 144.661°E), 2013-10-25 17:10:19 UTC, 326km (203mi) E of Namie, Japan (according to the USGS). In approximately 15 minutes, a 2-cm leading depression of the tsunami was first recorded by the Japanese-owned tsunameter/DART® buoy 21348. Forecast results shown below were created with the NOAA forecast method using MOST model with the tsunami source inferred from tsunameter/DART® data.
The graphics display research forecast results, showing qualitative and quantitative information about the tsunami, including tsunami wave interaction with ocean floor bathymetric features, and neighboring coastlines. Tsunami model amplitude information is shown color-coded according to the scale bar. Offshore tsunami wave amplitude was estimated based on actual tsunami observations at DARTs 21418 and 21348 and was not based on any particular earthquake mechanism.
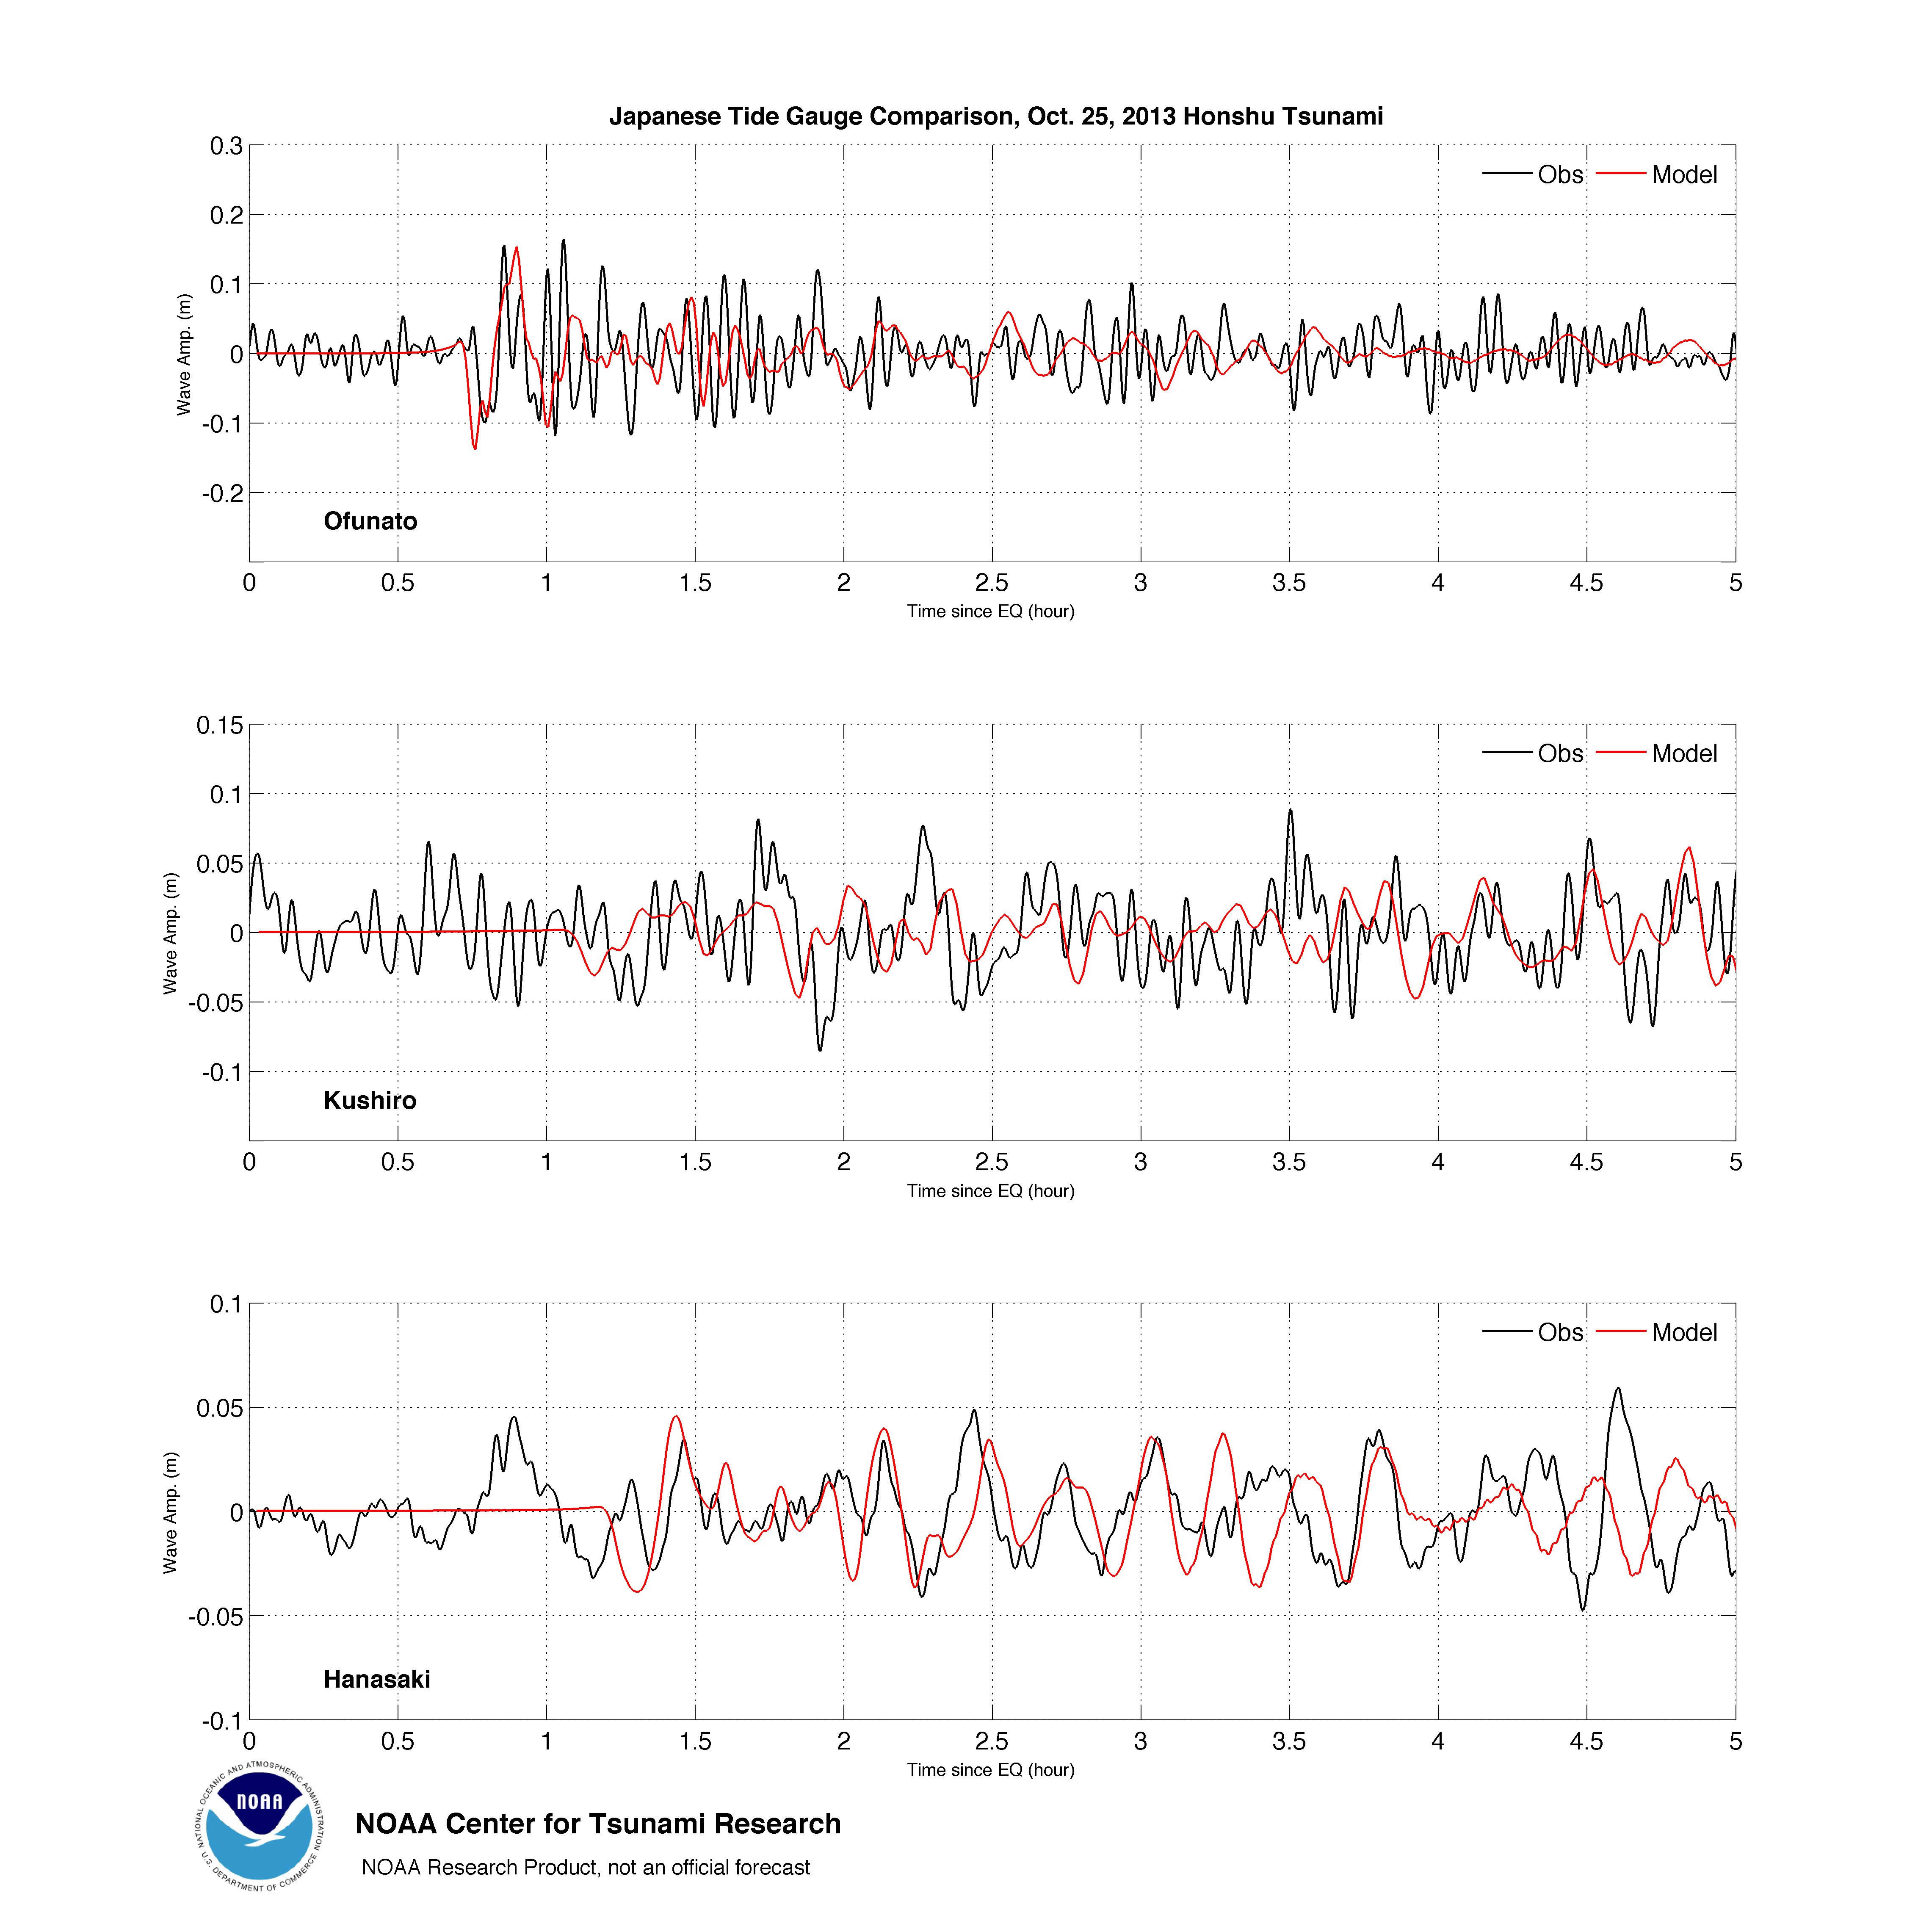
Modeling Results- Site map shows the location of the earthquake and tsunami source of the Honshu event. The yellow triangles are locations of DART stations in the northwest of Pacific. 21346, 21347 and 21348 are Japanese-owned DART stations. 21418, 21419 and 21413 are US-owned DART stations. 21401 is a Russian-owned DART station. The orange circles are the locations of tide gauges along Japan’s East Coast that are used for model/data comparison. The purple box indicates the tsunami source (lower-left inset) obtained from the data inversion.
- Model amplitudes calculated with the MOST forecast model. Filled colors show maximum computed tsunami amplitude in cm during 24 hours of wave propagation.
 Propagation animation and .mov file.
Model and DART® buoy data/ tide gauge data comparison
Comparison of the October 25, 2013 Honshu tsunami recorded at tsunameter/DARTs and tide gauges with model results. The DART model time series are obtained from the pre-computed generation/propagation forecast database in real time, after fitting models to tsunami records from the DARTs.
- DART
- Tide Gauges
- Unit Sources: 0.5*ki27e
Disclaimer: The forecasts on these pages show the results of ongoing research to enhance tsunami science and to improve NOAA operational tsunami forecasts. These products were developed during or shortly after the tsunami event, are intended for research use, and are not an official forecast. They should not be used as the basis of any public or private policy decisions. Please contact NCTR to find if there are more detailed follow-on analysis results.
For media inquiries:
When using information from this page, please credit NOAA / PMEL / Center for Tsunami Research