Solitary Wave on a Composite Beach
Models that perform well with the solitary wave on simple beach experiments must still be tested with the Revere Beach composite beach geometry. Revere Beach is located approximately 6 miles northeast of Boston in the City of Revere, Massachusetts. To address beach erosion and severe flooding problems, a physical model was constructed at the Coastal Engineering Laboratory of the U.S. Army Corps of Engineers, Vicksburg, Mississippi facility, earlier known as Coastal Engineering Research Center. The model beach consists of three piecewise-linear slopes of 1:53, 1:150, and 1:13 from seaward to shoreward with a vertical wall at the shoreline (Fig. 1). In the laboratory, to evaluate the overtopping of the seawall, the wavemaker was located at 23.22 m and tests were done at two depths, 18.8 cm and 21.8 cm.
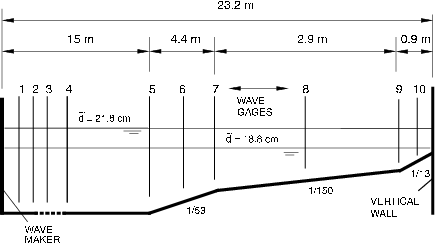 |
Figure 1 : Definition sketch for Revere Beach. Not to scale. Transition points and segments are numbered from shoreward to seaward, i.e., segment numbers 1, 2, 3, and 4 show 1/13, 1/150, 1/53, and constant-depth segments, transition opints 1, 2, and 3 show transition points between 1/13 and 1/150, 1/150 and 1/53, and 1/53 and constant-depth segment, respectively. |
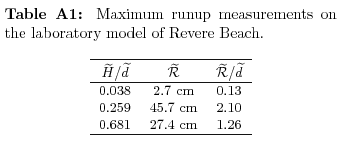
In the experiments, solitary waves of different heights x were generated at the location Xs. In terms of specific measurements, time histories of the water surface elevations exist for x = 0.038 at x2 = 12.22m, x = 0.259 at x2 = 13.96m, and for x = 0.681 at x2 = 14.37m. In all cases, d = 21.8cm. x2 = 0 is at one end of the wave flume, i.e., this initial shoreline where the veritcal wall is at x2 = 23.22m. Other water-surface eleveation time series were measured mideway in each sloping segment, i.e., at x2 = 17.22m and d = 17.7cm, at x2 = 20.86m and d = 12.5 cm and x2 = 22.80 and d = 8.1cm. Time histories of water surface elevelations are given in Figures 2, 3, and 4 for three different wave heights. The maximum runup values are given in Table A1 for the three cases presented here. A comparison of numerical results with a laboratory case near the breaking limit offshore will ensure that the code remains stable, even for extreme waves. The maximum runup values on the vertical wall were measured visually and are presented in Figure 5 for the whole experimental parameter range.
 |
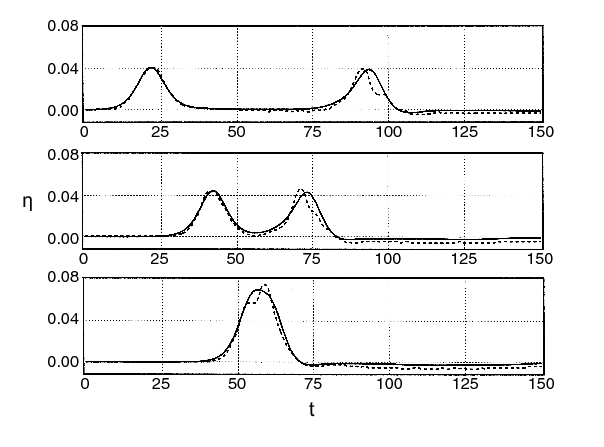 |
| Figure 2: Comparison of the time histories of the free surface elevations midway in each sloping segment for the analytical solutin of Kanoglu and Synolakis (1998) and the laboratory data for x = 0.038 solitary wave. |
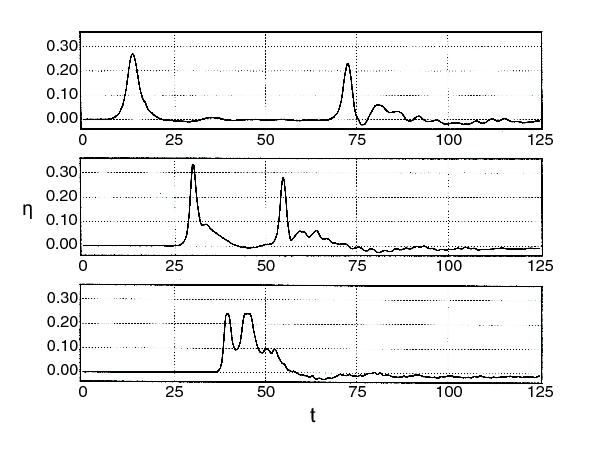 |
| Figure 3 : The laboratory data for the time histories of the free surface elevations midway in each sloping segment for x = 0.259 solitary wave. |
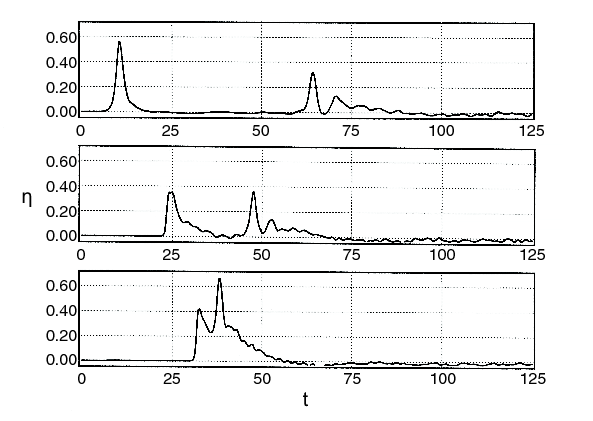 |
| Figure 4 :The laboratory data for the time histories of the free surface elevations midway in each sloping segment for x = 0.681 solitary wave |
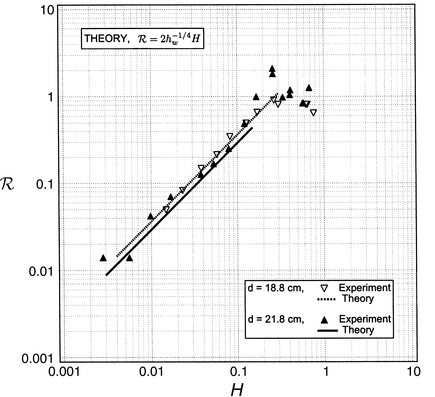 |
| Figure 5 :Comparison of maximum runup values for the linear analytical solution and laboratory results for two different depths, i.e., d = 18. 8 cm and d = 21. 8 cm. |
More information on the laboratory experiment can be found at the Coastal & Hydraulics Laboratory, and the data can also be downloaded here (zip file).