Not an official forecast
Alaska Tsunami, March 28, 1964
Main Event Page
At 03:36:14.0 UTC on March 28th, 1964 (local time 17:36 March 27th), a Mw 9.2 earthquake (61.05°N 147.48°W), 120km (75 miles) east of Anchorage (according to the USGS), Alaska generating a major tsunami that struck the southeast coast of Alaska, British Columbia, U.S. West coast and Hawaii. The main tsunami generated local runup of more than 30m at Alaskan shorelines with runup over 60 meters reported in Valdez harbor, possibly due to associated landslide (The Great Alaska Earthquake of 1964, National Research Council Report v.5, Washington, DC, 1972). Tsunami propagated across the Pacific causing damage estimated at almost $1 billion and killing over 130 people.
The year of 2014 marks 50th Anniversary of the Great Alaska Earthquake and Tsunamis. Today's tsunami warning and forecast capability involves detection and modeling components that were not available in 1964. This page outlines tsunami model of the 1964 tsunami produced with NOAA tsunami forecast tools. This model illustrates the advancements of tsunami warning technology that includes real-time tsunami forecast capability illustrated on the example of 1964 Great Alaska Tsunami scenario.
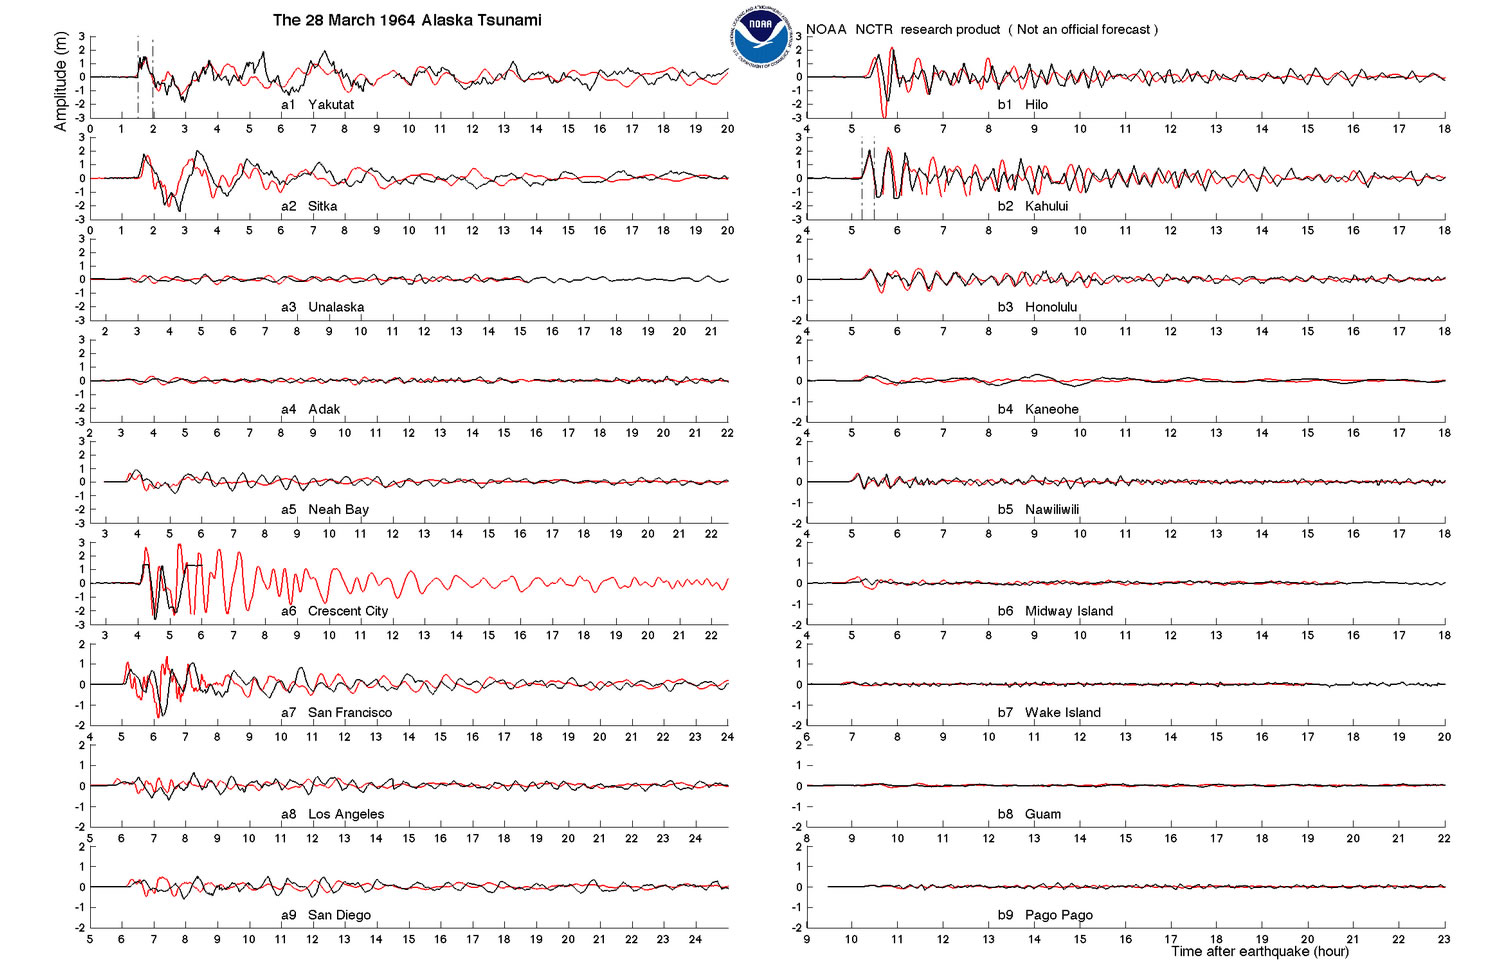
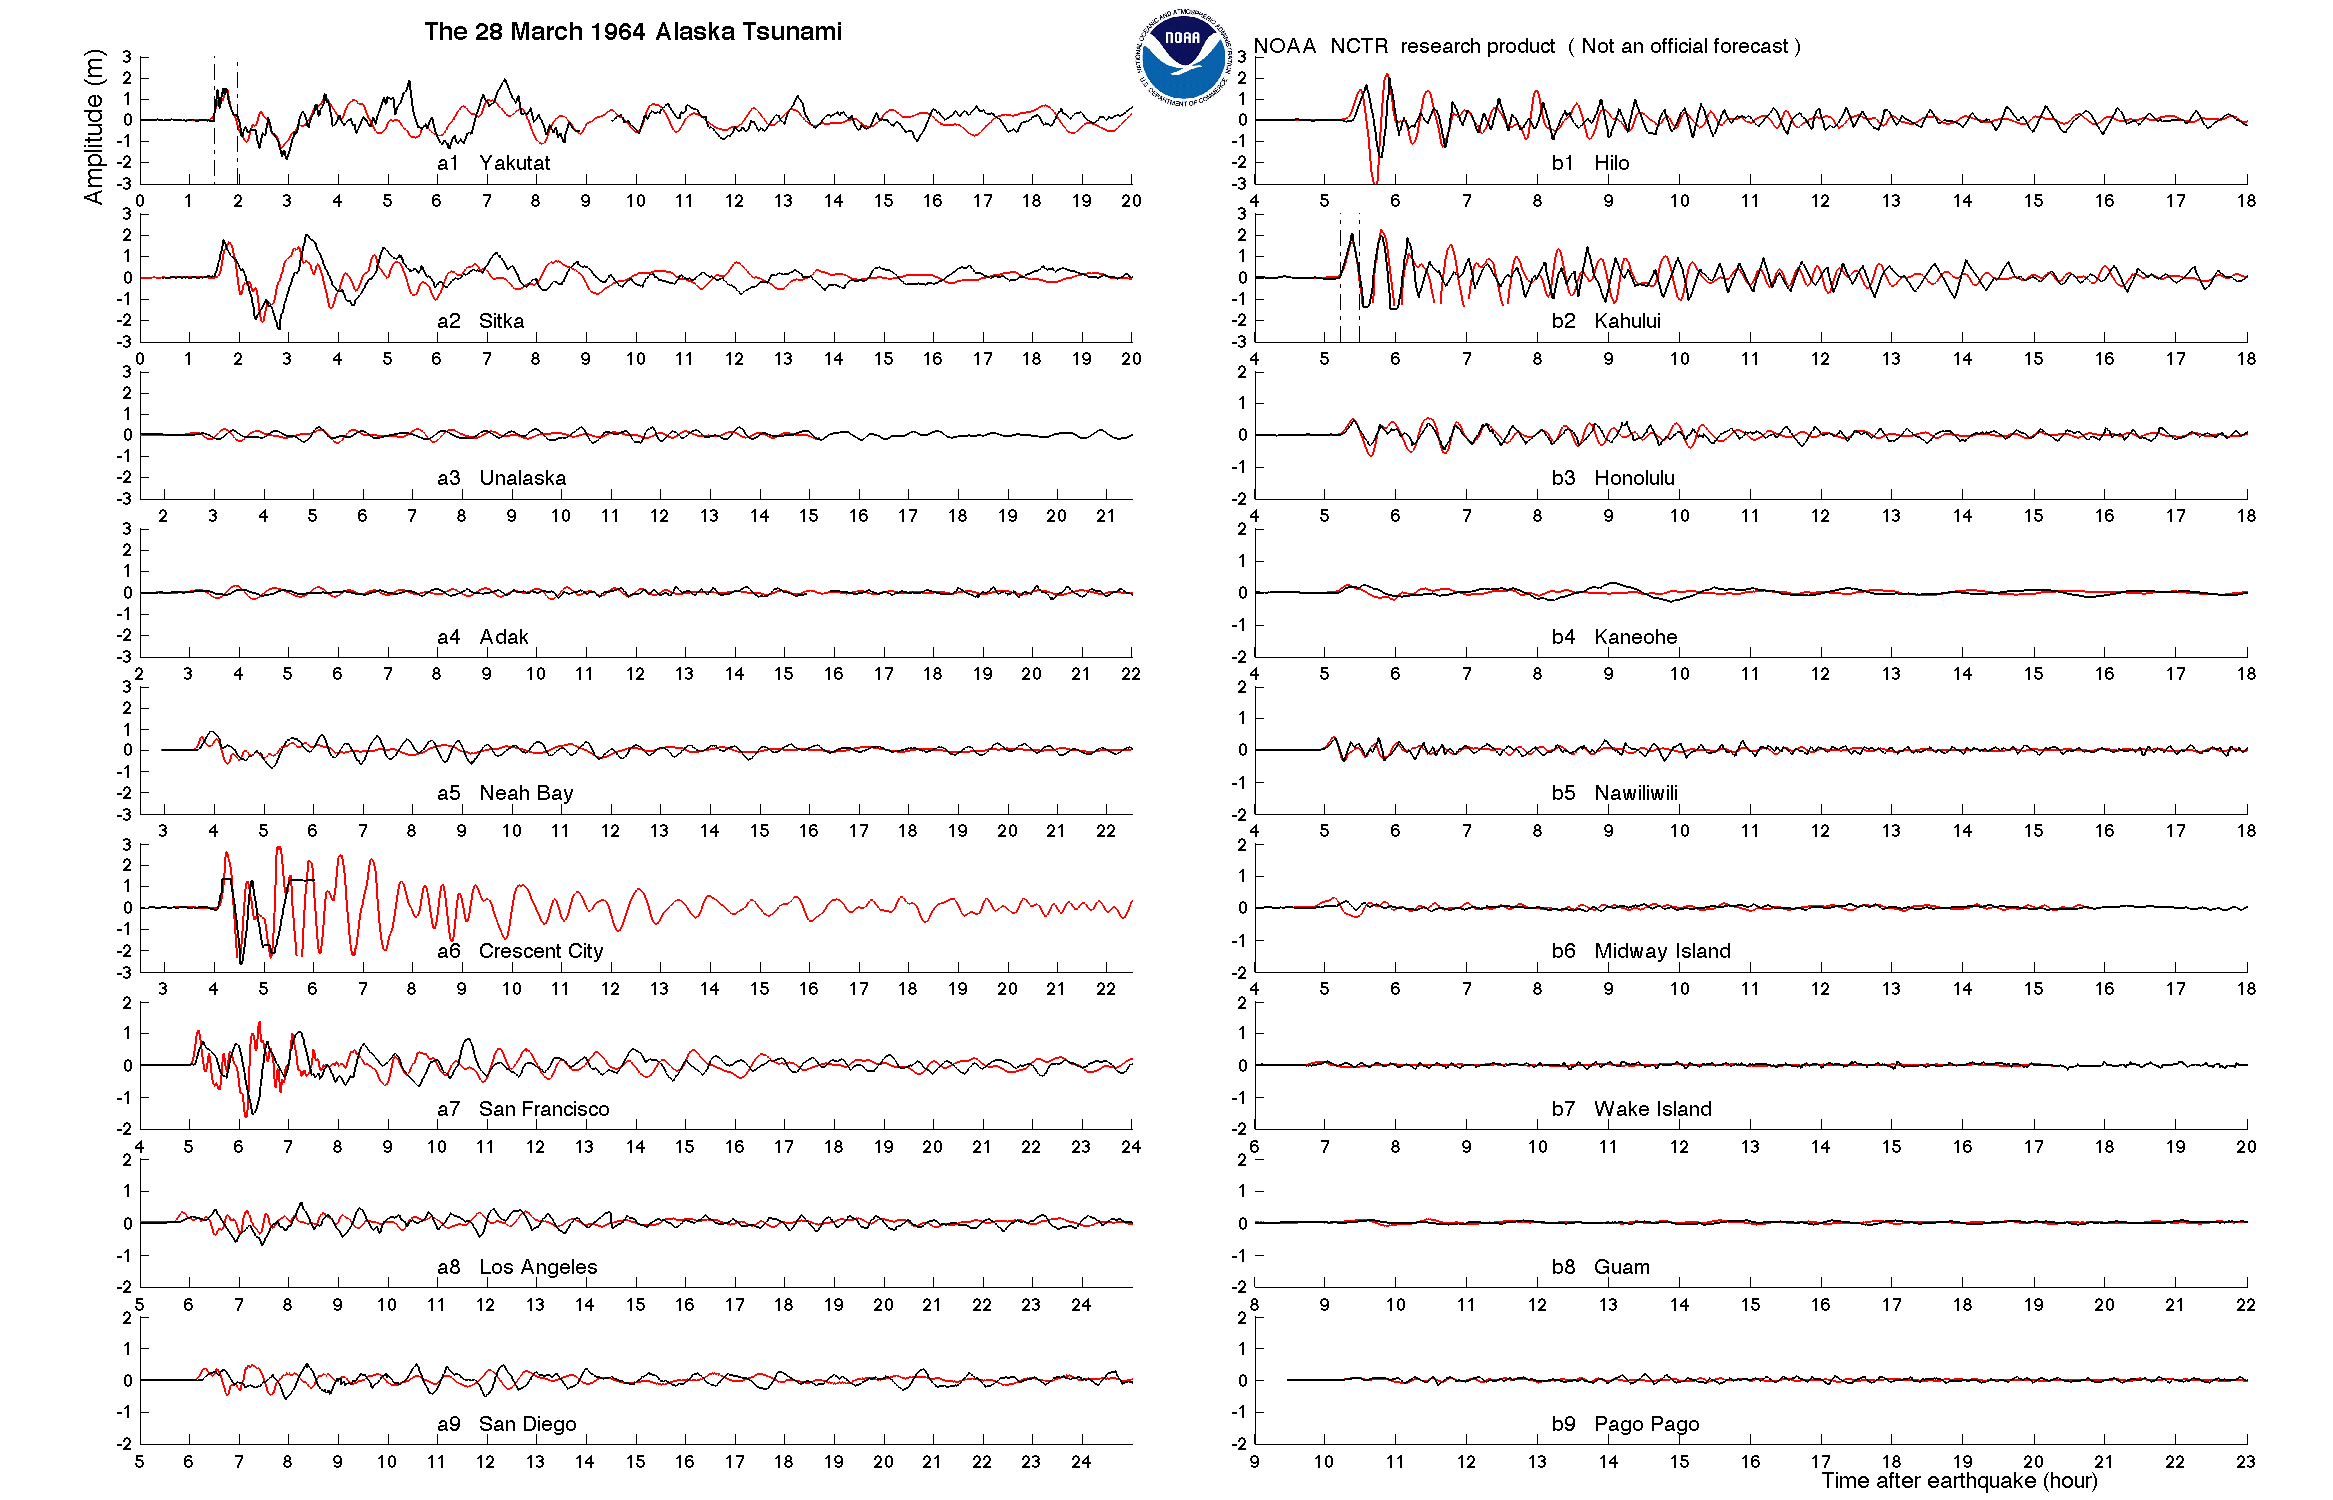
In 1964, there was no real-time tsunami detection capability in deep ocean that is used to constrain the forecast model today. Only tide gage data of tsunami are available. The tsunami source model is constrained by the location of the seismic source and two tide gage records at Yakutat and Kahului. At present, a forecast model will be constrained by DART data within an hour from the earthquake.
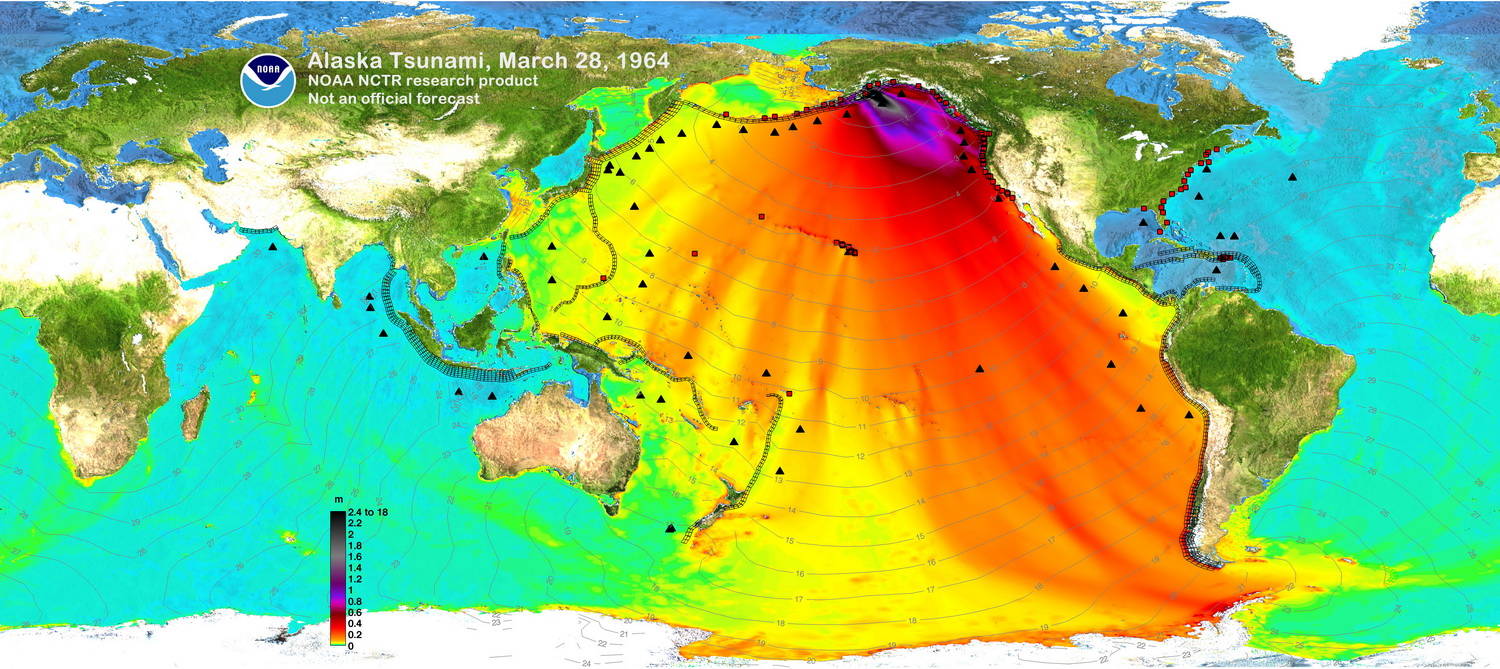
The graphics display model results, showing qualitative and quantitative information about the tsunami, including tsunami wave interaction with ocean floor bathymetric features, and neighboring coastlines. Tsunami model amplitude information is shown color-coded according the scale bar. Offshore tsunami wave amplitude was forecasted based on actual tsunami observations at tide gages and was not based on any particular earthquake mechanism.
Model tsunami wave amplitudes calculated with the MOST forecast model. Filled colors show maximum computed tsunami amplitude in cm during 24 or 48 hours of wave propagation. Black contours show computed tsunami arrival time.
- Global maximum tsunami wave amplitude (larger plot)
 YouTube video of the global propagation of the tsunami wave (also see .mp4 file)
- Alternate YouTube video of the global propagation of the tsunami wave (with model-data comparison).
- Global propagation animation (with model validation time series) and high resolution global animation (.mov files).
Model and tide gauge data comparison
- Composite tide gage comparison plot (larger size)
- Unit Sources: 15.4*a34 + 18.3*b34 + 48.3*z34 + 19.4*a35 + 15.1*b35
Disclaimer: The forecasts on these pages show the results of ongoing research to enhance tsunami science and to improve NOAA operational tsunami forecasts. These products were developed during or shortly after the tsunami event, are intended for research use, and are not an official forecast. They should not be used as the basis of any public or private policy decisions. Please contact NCTR to find if there are more detailed follow-on analysis results.
For media inquiries:
When using information from this page, please credit NOAA / PMEL / Center for Tsunami Research