M. C. Eble and F. I. Gonzalez
NOAA, Pacific Marine Environmental Laboratory
NOAA Building Number 3
7600 Sand Point way N.E.
Seattle, WA 98115.
(Manuscript received 5 May 1990, in final form 10 October 1990)
ABSTRACT
Pressure transducers with quartz-crystal resonators are being used to measure deep-ocean bottom pressure in the northeast Pacific as part of a long-term monitoring program. In principal, instrument sensitivity is less than 1 mm for sea-level oscillations of periods greater than a few minutes; in practice, however, system resolution is limited by long-term sensor drift and background noise. Data are digitally recorded at a rate of 64 samples per hour but selectable intervals ranging from 4 to 128 samples per hour are possible. The field program has focused on the maintenance of five permanent stations in the northeast Pacific since 1986. During this time, phenomena over a wide range of time scales have been recorded, including tides and the seismic surface waves and tsunamis generated by three earthquakes in the Alaskan sight.
1. Introduction
High-quality bottom pressure recorder ( BPR ) measurements in the deep ocean contribute to a fundamental understanding of oceanographic processes over a wide range of time scales. These vary from long-period fluctuations induced by planetary waves, oceanic tides, and meteorological forcing events, to relatively shorter-period phenomena such as long surface gravity waves, microseisms, and tsunamis. To capture these events, several types of transducers have been incorporated into pressure sensor units designed for oceanic applications. The most common types include the vibrating wire, strain gauge, quartz-resonator, Bourdon tube, and various capacitance devices. Vibrating wire designs typically correlate vibrational frequency with pressure-induced mechanical motion (Lefcort 1968; Vitousek and Miller 1970). Capacitance plate transducers such as those described by Harris and Tucker (1963) incorporate parallel capacitance plates in which the distance between plates varies as a function of applied pressure. Capacitance is inversely proportional to the plate gap and acts to tune an LC oscillator. Although an improvement over vibrating wire designs with respect to accuracy, flexibility, and cost, instability was inherent in the mechanical design of the capacitance plate transducer. As an improved alternative, the strain gauge was developed and extensively used by researchers at the Institute of Oceanographic Sciences in Wormley. Strain gauge pressure sensors utilize the variation in the resistance of a conductor with mechanical deformation caused by pressure acting on a flexible element. Many designs have been used, most incorporating a Wheatstone bridge to increase the sensitivity and minimize temperature effects. Gwilliam and Collar (1974) and Collar and Cartwright (1972) report on successful uses of strain gauge sensors to measure tides. They are not, however, well suited for long-term deep deployments where a large dynamic range, high sensitivity, and low drift are required. In contrast to the strain gauge, quartz-resonator transducers measure the changes in vibrational frequency of a quartz beam. An early Hewlett-Packard sensor utilized a piezoelectric resonator characterized by increased pressure sensitivity and decreased temperature dependency. This design represented an improvement over previous designs incorporating the vibrating wire, capacitance plate, and strain gauges (Gwilliam and Collar 1974). More recent quartz-crystal transducers, such as those currently marketed by Paroscientific, Inc., display somewhat improved long-term stability and significantly greater accuracy than their predecessors (Wearn 1985a; Wearn 1985b).
Eyries (1968), Snodgrass (1968), and Filloux (1969) are recognized as pioneers in the development and deployment of self-contained bottom recording pressure units (Warren and Wunsch 1985). Since their early deployments of vibrating wires, strain gauges, and Bourdon-tube transducers to measure pelagic tides, the use of BPRs in oceanic programs has been diverse. Wearn and Baker (1980) studied transport fluctuations of the Antarctic Circumpolar Current using quartz-resonator pressure transducers deployed in Drake Passage. Wunsch and Wimbush (1977) incorporated vibrating wire and several strain gauge pressure transducers into a program designed to monitor the Florida Current in the Miami-Bimini region. In 1977, Beardsley et al. deployed strain gauges, vibrating wire, and Filloux Bourdon-tube pressure transducers in the middle Atlantic Bight to study both ocean tides and weather-induced bottom pressure fluctuations. In the equatorial Pacific near the Galapagos Islands, Bernard and Milburn (1985) deployed quartz-resonator transducers as part of a long-wave observational program. Wyrtki (1979), also deployed pressure transducers in the Equatorial Pacific to monitor currents via sea-level variations. Mofjeld and Wimbush (1977) deployed Filloux Bourdon-tube transducers in the Gulf of Mexico and the Caribbean to measure tides. More recently, quartz-resonator transducers have been used by Fox (1990) for the investigation of hydrothermal venting activity as evidenced by ground deformation in the Axial Seamount caldera on the Juan de Fuca ridge, and by Gonzalez et al. (1990) who successfully detected small tsunamis in the northeast Pacific Ocean after they were generated by three Alaskan Bight earthquakes in 1987 and 1988.
This paper discusses the observational program initiated in 1986 by the Pacific Marine Environmental Laboratory ( PMEL) of the National Oceanic and Atmospheric Administration (NOAA) and focuses on instrumentation and data characteristics.
Representative examples of data collected in the northeast Pacific in 1987 and 1988 are presented.
2. The Pacific Tsunami Observation Program
During the 1982-1985 period, PMEL engaged in the development of a reliable deep-ocean BPR; Bernard and Milburn (1985) used this first generation instrumentation for their long-wave observational work in the equatorial Pacific. In 1986, NOAA initiated a long-term field program in the northeast Pacific dedicated to collecting high-quality deep-water data during a tsunami. The program was expanded in 1987 to include shallow-water BPR sites maintained and operated by the United States Army Corps of Engineers along the United States west coast and in Hawaii (Gonzalez et al. 1987). The Pacific Tsunami Observation Program (PacTOP) includes five permanent deep-ocean observational sites in the northeast Pacific Ocean to monitor the seismically active Alaska-Aleutian Seismic Zone because of the potential threat to United States coastal regions, including Alaska, the contiguous United States west coast, and the Hawaiian Islands. A map of the study area including the 1987- 1988 observational network is shown in Fig. 1. A triangular array of three BPRs was positioned in close proximity to the Shumigan Seismic Gap, a region identified as having a high probability of experiencing a great earthquake capable of tsunami generation (Jacob 1984; Nishenko and Jacob 1990). A fourth BPR was located near the expected source region on the landward slope of the Aleutian Trench, and the fifth observational site was located offshore of the United States Pacific Northwest coast. This latter station is near the great circle route connecting the Shumigan Seismic Gap region with Crescent City, California, a city that suffered 11 fatalities and sustained more than 7 million dollars worth of damage during the 1964 Alaskan earthquake tsunami (Spaeth and Berkman 1967).
Fig. 1. The 1987-1988 PacTOP Network. Hachured regions are seismic gaps.
The research objectives of the project have broadened to include other oceanographic phenomena that can be investigated through measurement of deep-ocean bottom pressure.
With this expansion of project goals in mind, the initial sites were chosen to supplement BPR time series with other sources of oceanographic and meteorological data.
The West Coast site and the triangular array are each situated in the vicinity of a permanently moored NOAA National Data Buoy Center ( NDBC) environmental buoy, which provides hourly observations of atmospheric pressure, surface wind speed and direction, air and sea surface temperature, and sea state.
Prior to the failure of the United States Navy Geodetic Satellite (Geosat) in January 1990, each site was within a few kilometers of the Geosat ground tracks, along which altimeter-derived estimates of sea-level variations were obtained.
Each apex of the triangular array was situated at the crossover point of the ground tracks of an ascending and descending orbital pair.
3. Instrumentation
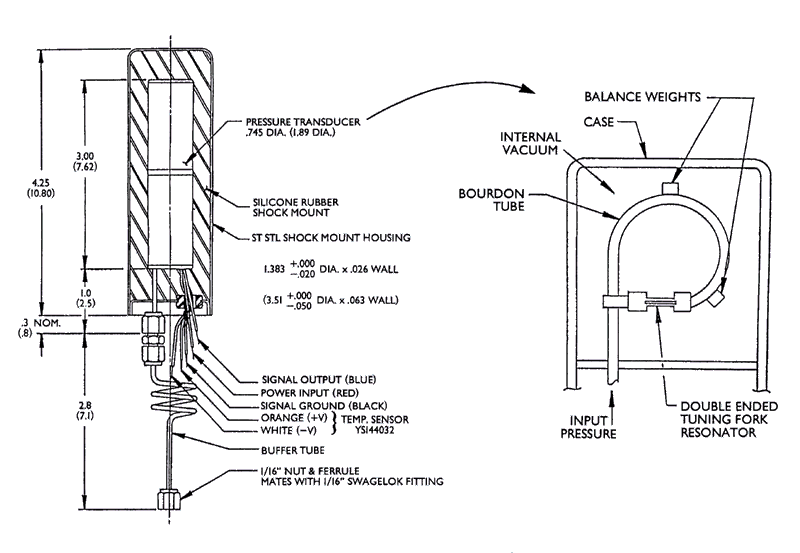
The Paroscientific model 410K-017 digiquartz pressure transducer, which has a range of 0-10 000 psi (absolute) (~0-6900 m), is incorporated into the BPRs used for PacTOP. The transducer design (Fig. 2) utilizes an oscillating quartz-crystal beam that is piezoelectrically induced to vibrate in its lowest resonant, flexural mode (Wearn and Larson 1982). Changes in fluid pressure are converted into a change in the axial compressive load on the beam via a Bourdon tube and lever arm arrangement. In turn, the change in the axial load alters the natural vibrational frequency of the beam. The output frequency of the associated oscillator circuit is a measure of the applied external pressure; typical unloaded transducer frequencies are on the order of 40 000 Hz. Since the frequency of transducer oscillation is a function of temperature as well as pressure, accurate temperature measurements are made inside of the pressure transducer cavity housing the quartz crystal. A quartz-crystal clock controls the averaging period of all measurements, and pressure data are digitally recorded on cassette tape at selectable intervals ranging from 4 to 128 samples per hour. PacTOP pressure data are continuous time averages over 56.25-s intervals (i.e., 64 samples per hour). Temperature data are recorded every 15 min. Improved technology, however, has made possible the design and fabrication of a BPR capable of sampling both pressure and temperature at 15-s intervals while retaining the required pressure sensitivity of better than 1 mm. The first deployment of this "third generation" BPR was during the 1989-1990 field season (AK22). Subsequent deployments are scheduled during the 1990-1991 field season.
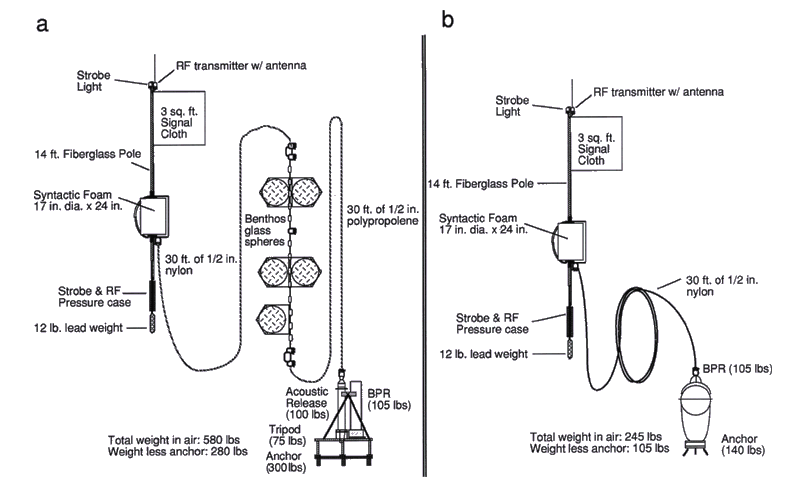
Two BPR models were designed and fabricated as a collaborative PMEL/SeaDATA effort for use in PacTOP. Model 635-7H is the earliest BPR version in which the electronics are housed in a cylindrical, anodized aluminum pressure case. The BPR unit and separate acoustic release are mounted on a circular platform with an aluminum tripod. Model 1635-7H is the later version, and is an adaptation of the Sea Data Inverted Echo Sounder (IES). A glass sphere houses all of the electronics, and a syntactic foam flotation package occupies a protective shroud. The anchor and burn-wire release mechanism are located at the bottom of the shroud. Upon deployment, each BPR model is tethered to a marker buoy equipped with a VHF transmitter and strobe light as recovery aids. Typical mooring configurations for each BPR model are shown in Fig. 3. BPR specifications including power requirements, clock crystal frequency and stability, tape recorder capacity, and battery type are given in Table 1.
a. Transducer conformance equation
The output of the Paroscientific pressure sensor is a sine wave of frequency f or period  .
To increase the sensitivity of the instrument, f is increased by means of a frequency multiplier circuit to obtain the output frequency F
 2nf.
An estimate of F is obtained by electronically counting the number of cycles, N, completed over one averaging period (or "integration period"),
  .
If the applied pressure is constant over this time interval, then the "count" or number of cycles counted, is given by:
N = F = 2nf
= 2nf = 2n
= 2n  /
/  ,
,
with n an integer. The relationship between applied pressure and the output frequency of a Paroscientific sensor is given by the conformance equation (WellTest Instruments, Inc. 1984)
| Pressure Sensor | |
| Type: | Paroscientific digiquartz model 410K |
| Range: | 10 000 psi (absolute) full scale |
| Resolution: | 0.15 ppm |
| Accuracy: | 0.015% of full scale, 0.003% corrected |
| Overrange: | 20% maximum without sensor damage |
Temperature Sensor | |
| Type: | Yellow Springs International Model 44032 thermistor |
| Range: | -4.3°C to +34.0°C (approximately linear) |
| Resolution: | 0.001°C |
| Accuracy: | 0.07°C (special versions to 0.01°C |
| Stability: | 0.005°C (small temperature excursions); 0.02°C (full range) |
| FM noise: | 0.002°C |
Time base | |
| Type: | Multimode quartz crystal oscillator |
| Frequency: | 2.097152 MHz |
| Stability: | 0.1 ppm °C-1, l ppm yr-1 |
Data collection | |
| Sampling rate: | Selectable at 4, 8, 16, 32, 64, or 128 measurements per hour |
| Storage media: | Standard 800 bpi, 4-track, digital certified, 450 cassette tapes |
| Capacity: | 15 megabits, corresponding to 6 x10⁵ pressure measurements |
Battery | |
| (635-7H) | 180 A-h lithium battery pack for sensor and logic, and 10 A-h alkaline for tape transport |
| (1635-7H) | 57.6 A-h battery pack for sensor and logic, 9.6 A-h for acoustic release, and 4.8 A-h for tape transport |
Power requirement | |
| (635-7H) | Average 7-mA drain rate @ 64 measurements per hour or 13 A-h per 100000 measurements |
| (1635-7H) | Average 4.5-mA data collection drain @ 64 samples per hour.
Average acoustic release drain 0.85 A-h per month |
P( ) = C { 1 - (
  o/
o/  )2 - D [1-(
 o/
o/  )2 ]2},
where  is the transducer period output in microseconds, D is the unitless linearization term ( ~0.03), and C and
  o are the temperature dependent calibration coefficients.
Coefficient C is known as the span coefficient with units equal to those of pressure, and
  o is the transducer period output at zero pressure.
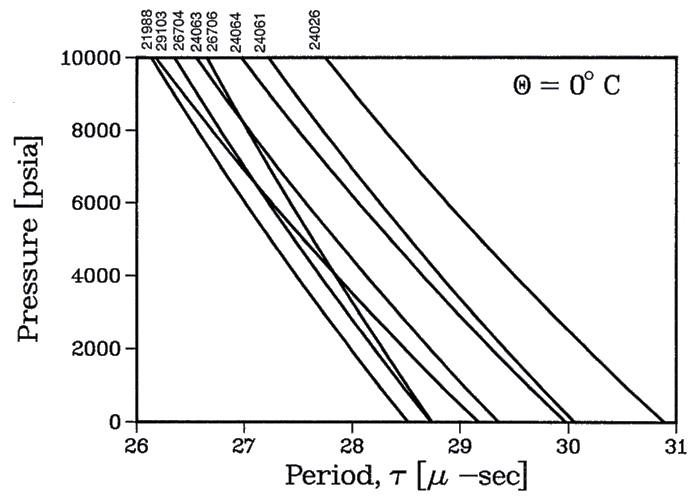
Calibration curves [ P(
  ) ] for selected PacTOP pressure transducers at a near-deployment temperature of 0°C are presented in Fig. 4.
b. Temperature sensitivity
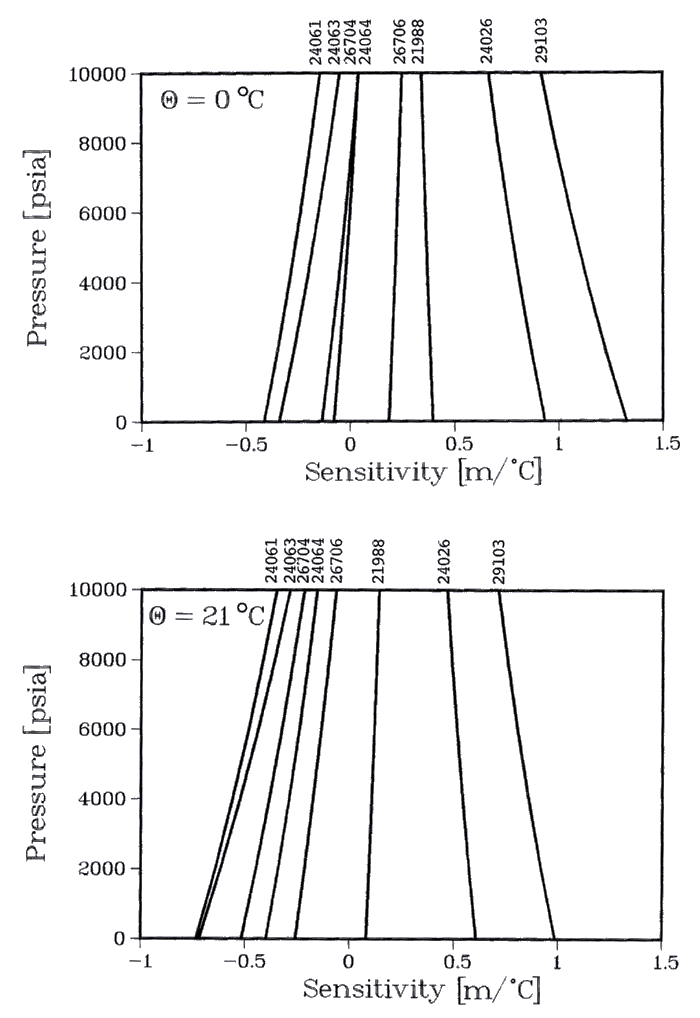
For sea-level estimates H and temperature  , Fig. 5 shows estimates of the temperature sensitivity
  H /
H / 
 ( m °C-1 ) as a function of the ambient pressure P, for
  = 0°C (Fig. 5a) and
  = 21 °C (Fig. 5b) for a number of sensors used in the PacTOP field program. There is considerable variation of temperature sensitivity ranging from -1 to 1.5 m °C-1 between specific sensors, with sensor 29103 identified as having the greatest temperature dependency at these two temperatures.
At 0°C sensor 24064 appears to be the least temperature dependent, while at 21°C sensor 21988 is the least temperature dependent.
The temperature sensitivity of each transducer is itself temperature dependent due to nonlinearities introduced in the computation of the temperature dependent coefficients (Eble et al. 1989).
This dependency is evident as a negative shift of all curves in Fig. 5 from 0° to 21 °C.
In general, the maximum sensitivity of the sensors used in the PacTOP field program is on the order of 1 m °C-1.
In a stable temperature environment such as the deep ocean this relatively large temperature dependency is moderated.
However, in shallow nearshore environments where temperature fluctuations are significant, accurate tracking of the temperature of the quartz-crystal sensor can be an important concern, especially if small, low frequency signals on the order of centimeters are of interest.
c. Static sensitivity
The static sensitivity of the instrument is given by
where No is the number of counts at zero pressure ( Eble et al. 1989).
For each particular instrument, this basic count No is kept constant by varying the integer n as a function of the integration period  .
The integration period was obtained by partitioning one hour into 2k equal divisions.
For
  in seconds, then,
No = Fo = 2n fo
  = 2n fo3600 / 2k
= 2n-k 3600 fo = 1800 fo,
where the relationship
was chosen to give each instrument a sensitivity of approximately 1 mm per count, as demonstrated below.
For k = 6,  = 56.25 s.
For representative values of C~ -45 X 103 psi (absolute), D~ 0.03, and
  o ~ 30
  s, then Fo ~ 1.056 X 10⁶ Hz and No = Fo
 ~ 59.4 X 10⁶ cycles.
The change in pressure corresponding to 1 instrument count (the "least count" sensitivity) when P = 0 psi (absolute) and dN = 1 cycle, then, is
| dP= | -2C ____ No |
= 2 X | 45 X 103 _________ 59.4 X 10⁶ |
= 1.5 X 10³ psi (absolute). |
In pure water, 1 psi (absolute) = 0.703 m, and in seawater, 1 psi (absolute) ~ 0.67 m = 670 mm, so that dH, the equivalent least count change of the seawater head, is ( Eble et al. 1989)
at P = 0. At the full-scale value of P ~ 104 psi (absolute), the quantity DP/ C << 1, for representative values of Dand C. Therefore, (1 - 4DP/C)1/2 = ~ 1 - 2 DP/ C and dP can be approximated by:
Typically, the magnitude of C is approximately five times the value of the full-scale pressure capability of the sensor so that
and the static sensitivity varies by approximately 12% across the entire range of the instrument. In practice, however system resolution is limited by long-term instrumental drift and ambient noise levels.
d. Hysteresis
Hysteresis is the measurement of a sensor's inability to return precisely to an initial indicated pressure after being cycled through a pressure excursion (Wearn and Larson 1980).
Results of tests performed using Bellows transducers by Wearn and Larson (1980) indicate that hysteresis values are likely to be largest when sensors are cycled rapidly through a pressure excursion and values are recorded soon after reaching the test pressure.
For high-range sensors, hysteresis measurements over a range corresponding to a 3-m tide were found by Wearn and Larson (1980) to be not reliably different from zero.
The Bourdon-tube transducers used for PacTOP display characteristics equal to or better than the Bellows transducers used by Wearn and Larson (1980) and are deployed in a stable deep-ocean environment, where pressure excursions in the tidal range occur more slowly than those induced in testing.
In the analyses of PacTOP data, then, hysteresis is considered insignificant and therefore not addressed.
4. Observations
Deep-ocean deployment and recovery operations in the northeast Pacific since 1986 are summarized in Table 2. Seventeen of the 28 deployment-recovery cycles listed have been completed with 12 units sited in the Alaskan array 3 on the Juan de Fuca Ridge and 2 on the Aleutian slope. Five units will be recovered during the summer 1990 field season and six units are scheduled for deployment at that time. Sixteen of 17 BPRs have been successfully recovered; the model 635-7H cylindrical unit deployed at location AK6 ( Fig. 1) was assumed lost after 2 unsuccessful recovery attempts. Actual data recovery rate is 82% due to data losses resulting from the lost AK6 gauge, questionable data recorded at AK2 by a model 635-7H cylindrical gauge, and losses at AK13 that occurred when a self-contained model 1635-7H BPR flooded, providing only 54 days worth of data and resulting in destruction of the gauge.
| Station | Paros S/N |
Position Lat(°N) - - - Long(°W) |
Deployment | Recovery | Depth (m) |
Location and comments |
|---|
| AK1 | 24063 | 52.61 | 155.558 | 13 Aug 1986 | 12 Aug 1987 | 4523 | Ak array |
| AK2 | 24064 | 52.09 | 155.69 | 13 Aug 1986 | 12 Aug 1987 | 4662 | AK array (questionable data quality) |
| AK3 | 24063 | 54.78 | 155.04 | 14 Aug 1986 | 11 Aug 1987 | 4695 | Ak array |
| AK4 | 24026 | 54.90 | 156.48 | 15 Aug 1986 | 11 Aug 1987 | 4600 | AK array |
| WC5 | 21988 | 44.86 | 130.36 | 19 Oct 1986 | 23 Apr 1987 | 2402 | Juan de Fuca Ridge |
| AK6 | 21988 | 52.02 | 155.72 | 12 Aug 1987 | Not recovered | 4684 | AK array (two failed recovery attempts) |
| AK7 | 29103 | 52.73 | 155.00 | 12 Aug 1987 | 18 Mar 1988 | 4463 | AK array |
| AK8 | 26706 | 52.73 | 156.47 | 13 Aug 1987 | 17 Mar 1988 | 4535 | AK array |
| WC9 | 24061 | 45.97 | 129.99 | 23 Sep1987 | 12 Jul 1988 | 1527 | Axial Caldera |
| AK10 | 24026 | 54.28 | 158.51 | 26 Oct 1987 | 28 Sep 1988 | 1656 | Aleutian Trench slope |
| AK11 | 24063 | 52.72 | 155.00 | 18 Mar 988 | 15 Sep 1988 | 4440 | AK array |
| AK12 | 24064 | 52.72 | 156.47 | 17 Mar 1988 | 16 Sep 1988 | 4516 | AK array |
| AK13 | 29103 | 52.02 | 155.72 | 28 Sep 1988 | 09 Jun 1989 | 4764 | AK array (flooded; only 54 days of data) |
| AK14 | 26704 | 54.16 | 155.24 | 28 Sep 1988 | 12 Sep 1989 | 4100 | Aleutian slope |
| WC15 | 24061 | 45.96 | 130.02 | 07 Sep1988 | 04 Aug 1989 | 1558 | Axial Caldera |
| AK16 | 24026 | 53.42 | 154.28 | 16 Sep 1988 | 11 Sep 1989 | 4471 | AK array |
| AK17 | 26706 | 53.42 | 157.22 | 17 Sep 1988 | 09 Jun 1989 | 4633 | AK array |
| AK18 | 24064 | 53.42 | 157.22 | 09 Jun 1989 | (Summer 1990) | 4583 | AK array |
| AK19 | 24063 | 52.02 | 155.72 | 09 Jun1989 | (Autumn 1990) | 4572 | AK array |
| WC20 | 24061 | 45.94 | 130.02 | 06 Sep 1989 | (Summer 1990) | 1550 | Axial Caldera |
| AK21 | 26706 | 53.41 | 154.28 | 15 Sep 1989 | (Autumn 1990) | 4473 | AK array |
| AK22 | 30043 | 54.16 | 158.24 | 12 Sep 1989 | (Summer 1990) | 4041 | Aluetian Trench slope |
| AK23 | 53.4 | 157.2 | (Summer 1990) | (Summer 1991) | ~4600 | AK array | |
| AK24 | 54.2 | 158.2 | (Summer 1990) | (Autumn 1990) | ~4000 | Aleutian Trench slope | |
| WC25 | 45.9 | 130.0 | (Summer 1990) | (Summer 1991) | ~1550 | Axial Caldera | |
| AK26 | 54.2 | 158.2 | (Autumn 1990) | (Summer 1991) | ~4000 | Aleutian Trench slope | |
| AK27 | 53.4 | 154.3 | (Autumn 1990) | (Summer 1991) | ~4470 | AK array | |
| AK28 | 52.0 | 155.7 | (Autumn 1990) | (Summer 1991) | ~4600 | AK array |
a. Tides
All PacTOP BPR data are dominated by local tidal fluctuations, as illustrated in Fig. 6.
Since the tides mask any recorded low-magnitude tsunami signal present in the data record they are removed from each record by subtraction of the predicted tide from each observed data record.
Before these estimates are made, sampling noise and high-frequency components are reduced by applying a 2-h low-pass filter.
After filtering, all data are decimated to hourly subsamples for tidal analysis by three independent procedures.
Fast Fourier transform ( FFT ) analyses of sequential 29-day data segments are used for a preliminary examination of the amplitude and phase of each dominant tidal constituent.
Significant changes in the sequential results, other than those attributable to seasonal fluctuations, are indicative of poor data quality and possible instrument unreliability.
Both harmonic least-square analyses and response analyses are routinely applied to each BPR dataset.
Harmonic least-square analysis as discussed by Foreman ( 1977 ) is used to perform a least-squares fit of the amplitude Aj and phase  j of each tidal constituent in order to minimize the resultant residual.
The response method of tidal analysis correlates an observed time series with a reference series for which the tides are known.
In our analysis, the reference series used is the tidal potential with three lags of -48, 0, and +48 h.
Munk and Cartwright ( 1966) provide a rigorous examination of the response analysis.
Because of good agreement between the results of both methods and a larger number of constituent results harmonic least-squares analysis is used to remove the tidal signal from each BPR record.
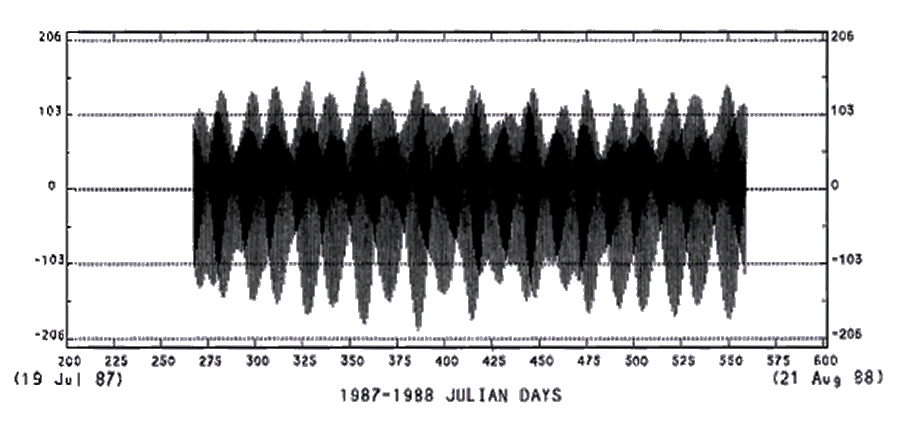
Several tidal studies have been conducted using pressure transducers in the deep ocean but tidal characteristics are routinely determined by tide gauges stationed predominantly in coastal and near-coastal zones. Consequently, the quantity of coastal tide data obtained far exceeds that obtained in the open ocean, and the behavior of open ocean tides is less understood. BPR technology provides the opportunity to increase the quantity of deep-ocean tidal data important for both numerical model verification and the intercomparison of analysis techniques. Model results such as those obtained by Schwiderski (1979, 1981 a-g) require data collaboration to increase confidence in the model accuracy, and tidal analysis techniques may be compared in the deep ocean where deployments greater than 1 yr are feasible. Results from harmonic least-square analysis of the recorded pressure at WC9, shown in Fig. 6, and Schwiderski's model results at the grid location corresponding with WC9's location (46°N, 130°W) are given in Table 3. The semidiurnal constituent M2 dominates the tidal signal at WC9 with the diurnal constituents Kl, Pl, and Ol accounting for a significant portion of the tidal energy. Amplitudes computed by Schwiderski are within 3%, and phases are within a few degrees of those observed at WC9.
| Constituent name |
Period (h) |
Amplitude (m) WC9 - - - Model |
Phase (UTC) WC9 - - - Model |
|---|
| Q1 | 26.87 | 0.045 | 0.046 | 218.1 | 212 |
| O1 | 25.82 | 0.249 | 0.23 | 226.2 | 228 |
| P1 | 24.07 | 0.128 | 0.120 | 236.4 | 240 |
| K1 | 23.93 | 0.408 | 0.40 | 241.4 | 243 |
| J1 | 23.10 | 0.027 | 252.9 | ||
| OO1 | 22.31 | 0.013 | 272.4 | ||
| 2N2 | 12.91 | 0.021 | 196.1 | ||
| MU2 | 12.87 | 0.017 | 189.9 | ||
| N2 | 12.66 | 0.162 | 0.15 | 213.4 | 213 |
| NU2 | 12.63 | 0.033 | 214.9 | ||
| M2 | 12.42 | 0.804 | 0.81 | 238.8 | 244 |
| L2 | 12.19 | 0.018 | 269.6 | ||
| S2 | 12.00 | 0.230 | 0.23 | 269.4 | 274 |
| K2 | 11.97 | 0.062 | 0.060 | 260.3 | 261 |
b. Drift
The residual pressure records (i.e., derited records) typically exhibit a long-term instrumental drift. Figure 7 shows examples of drift characterized by an exponential + linear function (Fig. 7a) and a predominantly linear trend (Fig. 7b). There are many possible causes of long-term drift, including slow sinking of the BPR into soft ocean bottom material, time-base drift, transducer-crystal aging, degradation of the vacuum in the crystal chamber, and creep of either the metal of the Bourdon tube itself or the joint material used to connect the crystal to the tube (R. Wearn, personal communication). The last of these mechanisms ( i.e., creep of materials) was shown to be reversible and repeatable (Wearn and Larson 1982) for an older Paroscientific transducer design that utilized metal bellows.
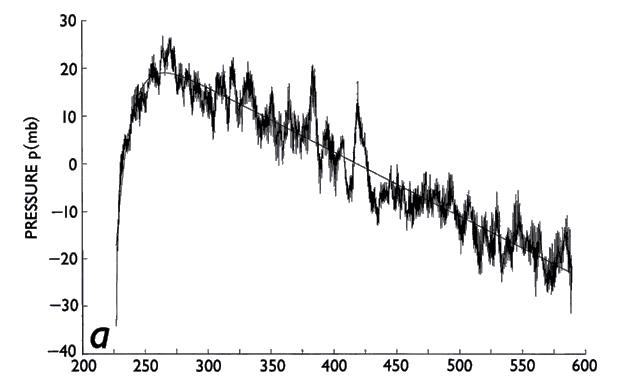
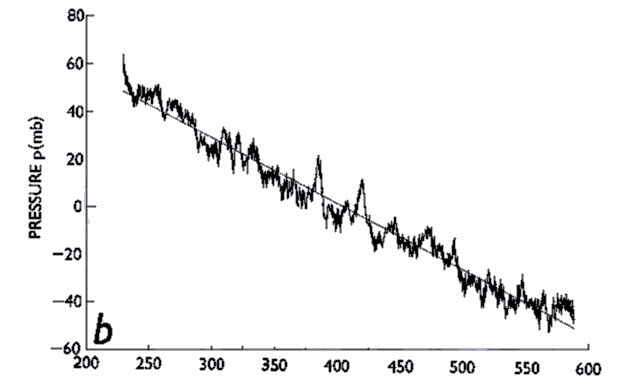
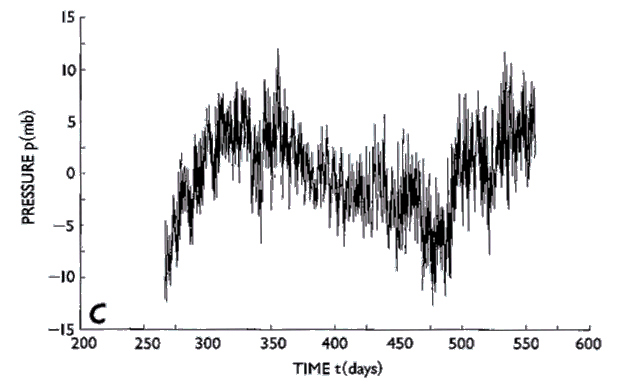
Fox (1990) has proposed that the low-frequency trend to higher pressure, which begins at approximately day 475 in Fig. 7c is not instrumental drift, but evidence of deflation of the Axial seamount caldera on which the BPR was situated. A low-frequency signal such as this would be easier to identify unambiguously if it were possible to experimentally determine the component of drift due to material creep for each individual transducer, assuming a similar mechanism is responsible for the creep in the Bourdon tube and metal bellows transducers. However, laboratory measurement of drift is impractical at this time since long-term maintenance of a stable high pressure and low temperature environment characteristic of the deep ocean bottom is very difficult. Instead we have adopted the usual approach of choosing an analytic function as a model for the total observed drift and then fitting this function to the data by means of least-square techniques. This approach is adequate for many investigations but is not appropriate for investigations of low frequency phenomena since the separation of instrumental drift and the environmental signal cannot be accomplished. Instrumental drift thus remains a severe limitation with respect to low frequency investigations.
c. 1987-1988 seismic waves and tsunamis
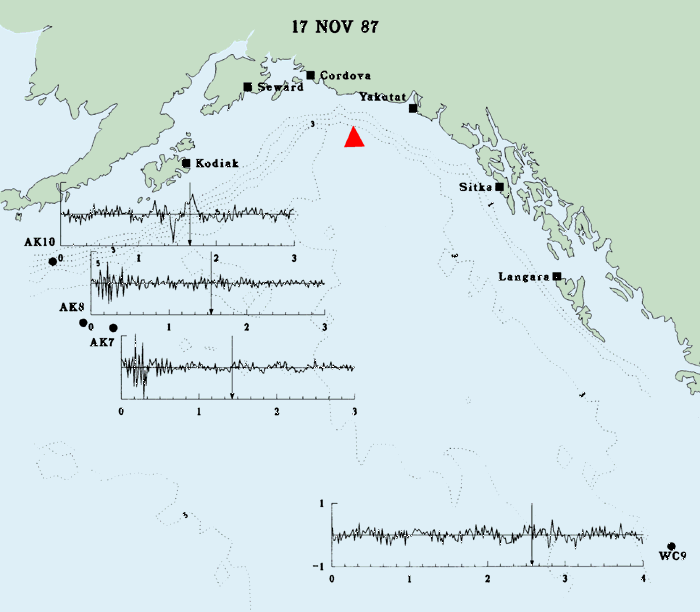
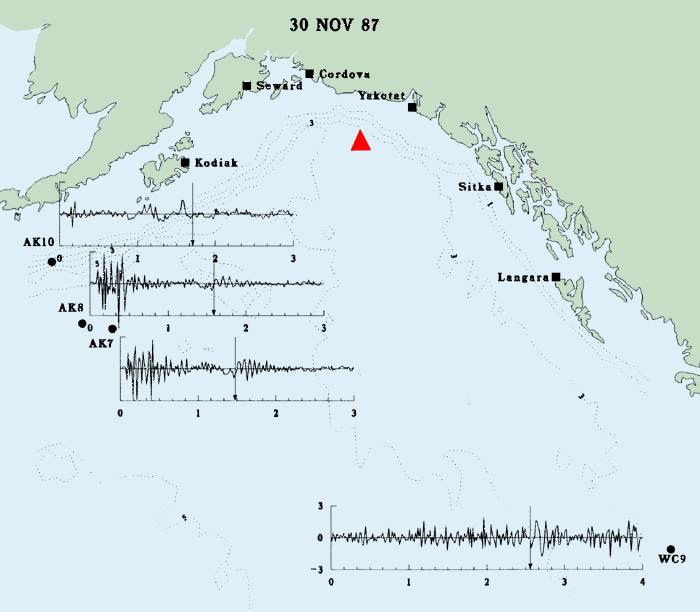
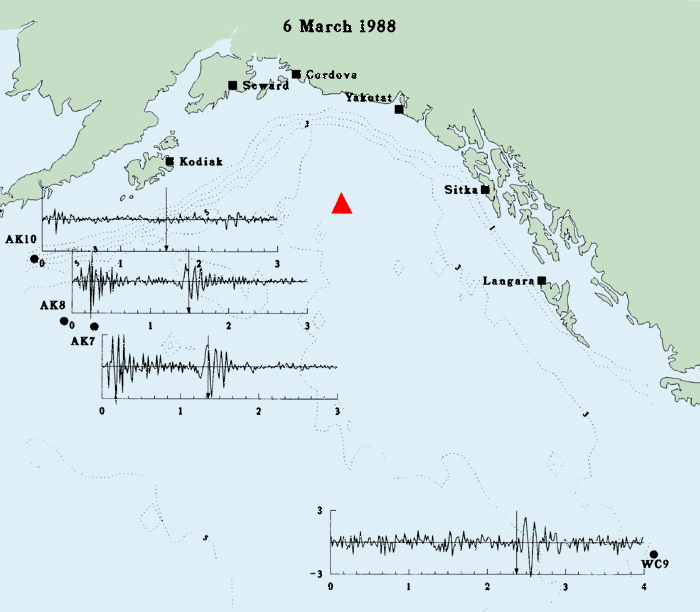
Three small tsunamis were generated by earthquakes that occurred in the Alaskan Bight on 17 and 30 November 1987 and on 6 March 1988. The 17 November earthquake was the smallest, with a 6.9 surface wave magnitude (Ms) and 40-km fault length. Both the 30 November and 6 March earthquakes registered 7.6 Ms with fault lengths of 140 km and 110 km, respectively (Lahr et al. 1988). BPR data recorded at four sites in the northeast Pacific Ocean during these three events are presented in Fig. 8. Earthquake epicenters are represented by a triangle, and estimated tsunami arrival times (ETA) are identified by vertical arrows. ETA estimates were computed by the Pacific Tsunami Warning Center in Ewa Beach Hawaii, using the shallow-water wave speed C = (gH)1/2 on a 1°, depth averaged grid. Because of the grid coarseness, precise agreement with BPR observed arrival times is not expected, but the ETA are sufficiently accurate to identify the portion of the record of interest.
On 17 November (Fig. 8a), stations AK7 and AK8 recorded the seismic surface wave. Tsunami wave energy is clearly apparent at station WC97 and AK7 and AK8 also appear to display a very low-amplitude tsunami signal, although at these sites the energy levels are weak compared with background energy levels. On 30 November (Fig. 8b) and 6 March (Fig. 8c) the seismic surface waves were recorded at AK7, AK8, and AK10. In addition the dispersive tsunami wave packet as described by classic wave theory was recorded at AK7, AK8, and WC9. Maximum recorded tsunami amplitudes (one-half of the largest crest to trough excursion) on 30 November at WC9, AK7, and AK8, are 1.7, 1.0, and 0.5 cm, respectively. Those recorded on 6 March are 2.8, 2.4, and 1.6 cm, respectively. AK10 was sited on the Aleutian Trench slope where local bathymetry probably affected any incident tsunami energy. The presence of this energy can be argued at AK10 based on amplitude considerations in the case of the 17 and 30 November 1987 events, and on wave period during the 6 March 1988 event. However, since unambiguous amplitudes and periods indicative of tsunami energy are absent during each event at AK10, any conclusion is uncertain. Gonzalez et al. (1990) discuss these data and provide comparisons of the deep ocean data with nonlinear shallow-water numerical model simulations.
All seismic surface wave data are aliased since seismic surface wave periods are on the order of seconds.
Aliasing of the tsunami data is probable but less clear; the rate of 64 samples per hour is acceptable for typical deep-ocean tsunamis having periods of 10-90 min but questionable for tsunamis we have recorded with periods of approximately 5 min.
Period differences are caused by differences in source region characteristics.
For example tsunamis generated by sources located on shallower continental shelves have periods that are longer than those of tsunamis generated in deep trench regions ( Kajiura 1979).
For this reason the detection of tsunamis generated at different sources is important to understanding the relationship between the generating mechanism and tsunami characteristics.
A prototype BPR capable of sampling at 15-s intervals is scheduled for deployment in September 1990.
5. Summary
Bottom pressure recorders are well suited to investigations of oceanographic processes over a wide range of time scales because of recent technological advancements. Commercially available quartz-crystal transducers display improved long-term stability and accuracy over their predecessors; sensitivities of better than 1 mm for periods greater than a few minutes are attainable in principal. In practice, however, background noise and instrumental drift degrade instrument sensitivity. Transducers such as these are being used in a long-term deep-ocean program to monitor tsunami activity in the Alaskan-Aleutian Seismic Zone. The seismic wave and tsunami generated by three recent earthquakes that occurred in this region were recorded at four of five permanent sites maintained in the northeast Pacific. Aliasing of these data is apparent and is being addressed through technological improvements that permit more rapid data collection while maintaining sensitivity standards. Lower-frequency events not affected by the aliasing problem such as meteorological and geophysical disturbances may be investigated using the bottom pressure recorder, although the inherent instrument drift must be addressed prior to the formulation of any results.
Acknowledgments. Estimated tsunami travel times were provided by W. Mass and R. Silcox of NOAA's Pacific Tsunami Warning Center. This work is contribution number 1196 of the Pacific Marine Environmental Laboratory's Tsunami project.
Beardsley, R. C., 11. Mofjeld, M. Wimbush, C. N. Flagg and J. A. Vermersch, Jr., 1977: Ocean tides and weather-induced bottom pressure fluctuations in the middle Atlantic bight. J. Geophys. Res., 82, 3174-3182.
Bernard, E. N., and H. B. Milburn, 1985: Long-wave observations near the Galapagos Islands. J. Geophys. Res., 90, 3361-3366.
Collar, P. G., and D. E. Cartwright, 1972: Open sea tidal measurements near the edge of the northwest European continental shelf. Deep-Sea Res. 19, 673-689.
Eble, M. C., F .l. Gonzalez, D. M. Mattens and H. B. Milburn, 1989: Instrumentation, field operations, and data processing for PMEL deep-ocean bottom pressure measurements. NOAA Technical Memorandum ERL PMEL-89, 71 pp. [NTIS PB90-114018]
Eyries, M., 1968: Maregraphes de grandes profondeurs. Cahiers Oceanogr, 20, 355-368.
Filloux, J. H., 1969: Bourdon tube deep-sea tide gauges. Tsunami in the Pacific Ocean, W. M. Sams, Ed., East- West Center Press, 223-238.
Foreman, M. G. G., 1977: Manual for tidal heights analysis and prediction. Pacific marine science report 77-10, Institute of Ocean Sciences, Patricia Bay, Victoria, B. C., 70 pp.
Fox, C. G., 1990: Evidence of active ground deformation on the mid-ocean ridge: Axial Seamount, Juan de Fuca Ridge, April-June, 1988. J. Geophys. Res., 9S, 12 813-12 822.
Gonzalez, F. l., E. N. Bernard, H. B. Milburn, D. Castel, J. Thomas and J. M. Hemsley, 1987: The Pacific Tsunami Observation Program (PacTOP). Proc. 1987 International Tsunami Symposium, IUGG, Vancouver, 3-19.
--C. L. Mader, M. C. Eble and E. N. Bernard, 1990: 1987-88 Alaskan Bight tsunamis: Deep-ocean data and model comparisons. Nat. Hazards, (in press).
Gwilliam, T. J. P., and P. G. Collar, 1974: A strain gauge pressure sensor for measuring tides on the continental shelf. Institute of Ocean Sciences Report No. 14., 27 pp.
Harris, M. J., and M. J. Tucker, 1963: A pressure recorder for measuring sea waves. Instrument Practice, 17, 1055- 1059.
Jacob, K. H., 1984: Estimates of long-term probabilities for future great earthquakes in the Aleutians. Geophys. Res. Lett., 11, 295298.
Kajiura, K., 1979: Tsunami Generation. Proc. of the National Science Foundation Workshop, Tetra Tech., Inc., Pasadena, 15-40.
Lahr, J. C., R. A. Page, C. D. Stephens and D. H. Christiansen, 1988: Unusual earthquakes in the Gulf of Alaska and fragmentation of the Pacific Plate. Geophys. Res. Lett., 15, 1483- 1486.
Lefcort, M. D., 1968: Vibrating wire pressure transducer technology. J. Atmos. Oceanic Technol. 2, 37-44.
Mofjeld, H. O., and M. Wimbush, 1977: Bottom pressure observations in the Gulf of Mexico and Caribbean Sea. Deep-Sea Res., 24, 987-1004.
Munk, W. H., and D. E. Cartwright, 1966: Tidal spectroscopy and prediction. Philosophical Transactions of the Royal Society A, 259, 533-581.
Nishenko, S. P., and K. H. Jacob, 1990: Seismic potential of the Queen Charlotte Alaska-Aleutian Seismic Zone. J. Geophys. Res., 95, 2511-2532.
Schwiderski, E. W., 1979: Global ocean tides. Part II: The semidiurnal principal lunar tides (M2). Atlas of Tidal Charts and Maps, NSWC-TR 79-414, NSWL Dahlgren, VA, 15 pp.
--, 1981a: Global ocean tides. Part III: The semidiurnal principal solar tide (S2). Atlas of Tidal Charts and Maps, NSWC-TR 81122, NSWL Dahlgren, VA, 12 pp.
--, 1981b: Global ocean tides. Part IV: The diurnal luni-solar declination tide (K 1). Atlas of Tidal Charts and Maps, NSWC-TR 81-142, NSWL Dahlgren, VA, 12 pp.
--, 1981 c: Global ocean tides. Part V: The diurnal principal lunar tide (O 1). Atlas of Tidal Charts and Maps, NSWC- TR 81 - 144, NSWL Dahlgren, VA, 11 pp.
--, 1981d: Global ocean tides. Part VI: The semidiurnal elliptical lunar tide (N2). Atlas of Tidal Charts and Maps, NSWC-TR 81 -218, NSWL. Dahlgren, VA, 11 pp.
--, 1981e: Global ocean tides. Part VII: The diurnal principal solar tide (Pl ). Atlas of Tidal Charts and Maps, NSWC-TR 81220, NSWL Dahlgren, VA, 11 pp.
--, 1981f: Global ocean tides. Part VIII: The semidiurnal luni-solar declination tide (K2). Atlas of Tidal Charts and Maps, NSWC-TR 81-222, NSWL Dahlgren, VA, 11 pp.
--, 1981g: Global ocean tides. Part IX: The diurnal elliptical lunar tide (Q 1). Atlas of Tidal Charts and Maps, NSWC-TR 81 224, NSWL Dahlgren, VA, 11 pp.
Snodgrass, F. E., 1968: Deep-sea instrument capsule. Science, 162, 78-87.
Spaeth, M. G., and S. C. Berkman, 1967: The Tsunami of 28 March 1964, as recorded at tide stations. U. S. Department of Commerce, ESSA Tech. Rep. C and GS 33, 86 pp.
Vitousek, M., and G. Miller, 1970: An instrumentation system for measuring tsunamis in the deep ocean. Tsunamis in the Pacific Ocean, East-West Center Press, 239-252.
Warren, B. A., and C. Wunsch, Eds., 1981: Evolution of Physical Oceanography. The MIT Press, 623 pp.
Wearn, R. B., Jr., 1985a: Year long stability measurements on paroscientific atmospheric pressure transducers. Tech. Note, Paroscientific, Inc., 6 pp.
--, 1985b: 15 July 1985 Technical Update Well-Test Instruments, Inc., 15 pp.
--, and D. J. Baker, Jr., 1980: Bottom pressure measurements across the Antarctic Circumpolar Current and their relation to the wind. Deep-Sea Res., 27, 875-888.
--, and N. G. Larson, 1980: The paroscientific pressure transducer, measurement of its sensitivities and drift. APL-UW 8011, 64 PP
--, and --, 1982: Measurements of the sensitivities of digiquartz pressure sensors. Deep-Sea Res., 29, 111 - 134.
Well-Test Instruments, Inc., 1984: Calibration, test, and characterization of Well-Test Instruments quartz crystal transducers. Document #8062-001, 17 pp.
Wunsch, C., and M. Wimbush, 1977: Simultaneous pressure, velocity and temperature measurements in the Florida Straits. J. Mar. Res. 35, 75-104.
Wyrtki, K. 1979: Sea level variations: Monitoring the breath of the Pacific. EOS, 60, 25-27.