Tsunami Devastates Japanese Coastal Region
Hokkaido Tsunami Survey Group
 |
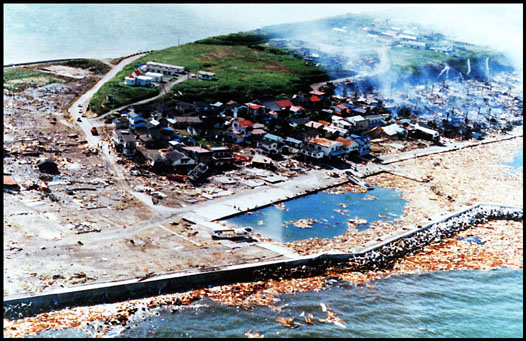
Fig. 1. A view of tsunami damage from the east of Aonae, a small town on the island of Okushiri, which is in the Sea of Japan, east of Hokkaido. (Courtesy of Y. Tsuji.) |
 |
Fig. 1. A view of tsunami damage from the east of Aonae, a small town on the island of Okushiri, which is in the Sea of Japan, east of Hokkaido. (Courtesy of Y. Tsuji.) |
The Hokkaido-Nansei-Oki earthquake on July 12 produced one of the largest tsunamis in Japan's history. At 2217 local time (1317 UTC), the Ms-7.8 quake rocked the west coast of Hokkaido and the small, offshore island of Okushiri in the Sea of Japan, generating a major tsunami. Within 2-5 minutes, extremely large waves engulfed the Okushiri coastline and the central west coast of Hokkaido. Extensive damage occurred on the southern tip of Okushiri Island at the town of Aonae (Figures I and 2). Figure 3 shows the location of the study area.
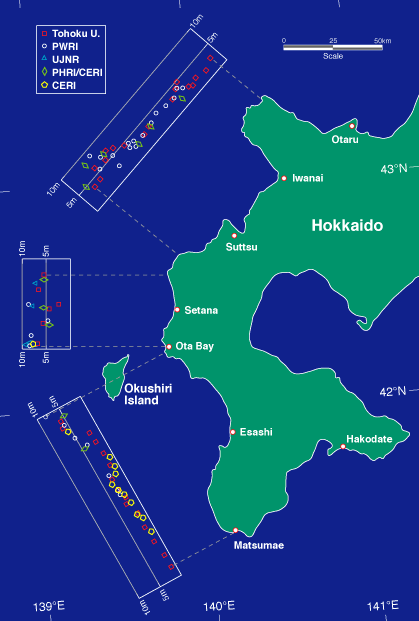
Tsunami vertical runup measurements varied between 15 and 30 m over a 20-km portion of the southern part of Okushiri Island, with several 10-m values on the northern portion of the island (Figure 4). Along the west coast of Hokkaido, no survey values exceeded 10 m, but damage was extensive at several coastal towns (Figure 5). Given the sudden onset of the tsunami and its high energy, it is amazing that more people were not killed.
As of July 21, 185 fatalities were confirmed, with 120 attributed to the tsunami. The death toll is expected to rise, as missing persons are included among the fatalities. Property losses have been estimated at $600 million, due principally to tsunami damage.
Immediately following the quake, the Japanese dispatched damage assessment and survey teams. Most of these Japanese teams were mobilized and began surveying tsunami runup by July 13; three U.S. scientists, under the auspices of the U.S.-Japan Cooperative Program in Natural Resources (UJNR), joined Japanese scientists to complement the tsunami survey on July 18.
 |
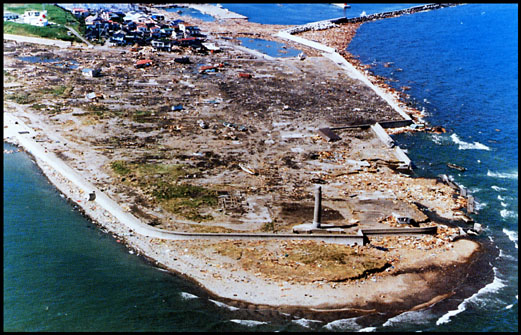
Fig. 2. A view of tsunami damage from the south of Aonae. (Courtesy of Y. Tsuji.) |
The primary measurements in the field surveys were the tsunami vertical and/or horizontal runup values, which are the maximum vertical height and/or horizontal extent of flooding. In this report, only vertical runup estimates are presented. Traces left by the tsunami include water marks on buildings, debris lines along the coast, or vegetation that is damaged or killed by salt water. Measurements of vertical height above sea level of the tsunami trace are obtained by a series of measurements down to the shoreline using a surveyor's staff and level. The effects of tides are normally removed from such measurements, but during the period of the survey, the predicted tidal range in the study area was only 2-30 cm, referred to mean sea level. Since this range is a relatively small fraction of the observed runup, the data presented in this report are not corrected for tides.
This report is a collaborative effort pooling 281 measurements by seven of the survey teams; 158 around the island of Okushiri and 93 along the western coast of Hokkaido. These measurements included 110 by Tohoku University, 48 by the Public Works Research Institute (PWRI), 44 through the combined efforts of the Port and Harbour Research Institute (PHRI) and the Civil Engineering Research Institute (CERI), 36 by the Japan Meteorological Agency (JMA), 28 by UJNR, and 15 by the University of Tokyo. Some sites were visited by more than one team as shown in Figures 4 and 5, which summarize the data.
Another very important source of information is the approximate time of tsunami arrival, as inferred by the time clocks stopped due to saltwater flooding. The UJNR team conducted an active search for such clocks in the tsunami debris and in the surrounding area of each of the twenty-eight sites visited. Eight stopped clocks were found in various locations--on the beach, in wrecked automobiles, and in homes and other buildings--which are taken to be a rough indication of tsunami arrival times.
 |
 version |
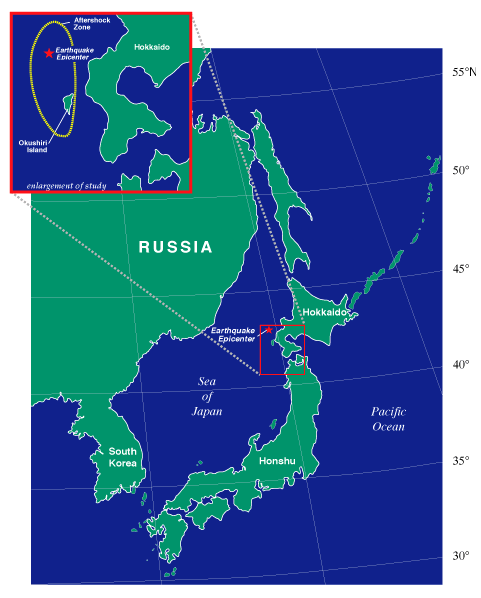
Fig. 3. Locator map of study area. Also shown in the inset is the survey area and the aftershock zone for a 40-hour period. |
Figure 3 provides an overview of the region, including the aftershock zone (courtesy JMA) for a 40-hour period and its location relative to Hokkaido and Okushiri Island. Note that this zone, frequently taken as an indicator of the area of crustal deformation, includes the island of Okushiri. The seismic moment of 5.6 x 1027 dyne/cm (corresponding to Mw = 7.8) with a (fixed) centroid depth (a point source representative of the overall faulting) of 15 km was estimated by Harvard University scientists. Assuming a fault length of about 150 km and a fault width of 50 km based on aftershock data and a shear modulus of 3 x 10¹¹ dyne/cm2, this moment and fault geometry suggests an average slip of 2.5 m on the fault plane. The focal mechanism estimated by Harvard has one nodal plane dipping eastward at 24ƒ from the horizontal. This fault plane orientation is comparable to the aftershock distribution and is consistent with subduction of the floor of the Japan Sea beneath northern Japan.
The tsunami was probably generate within the deformation area as defined by the aftershock pattern shown in Figure 3. Witness accounts collected by Y. Tsuji of the University of Tokyo and F. Imamura of Tohoku University indicate that the tsunami hit the west coast of Okushiri Island almost immediately after the main shock. The UJNR tsunami survey team found the electrical clock at an electrical power station had stopped at 2223, which was 6 minutes after the start of the earthquake. Along the west coast, the tsunami runup measurements were the highest from north of Monai to the southern tip (Figure 4). In the village of Monai, ten persons were killed and all twelve houses were destroyed. Runup measurements around the village were 20 m, and in a small valley north of Monai, the runup was measured at 31 m. South of Monai, tsunami runups between 15 and 20 m were measured all along the coast. Vegetation was stripped off the hillside, and large boulders (up to 1 m in diameter) were deposited where the vegetation was flooded. These data are consistent with the initial tsunami arriving from the west of Okushiri Island very near the generation area.
 |
 version |
Fig. 5. Distribution of vertical tsunami runup for the west coast of Hokkaido. Legend and data presentations are the same as in Figure 4. |
The tsunami was refracted by the shoaling bathymetry at both ends of the island. Hardest hit was the town of Aonae (population 1600), where the first tsunami wave flooded the southern tip of the island and the entire first row of houses in the harbor area within 4-5 minutes after the main shock (Figures 1 and 2). Tsuji reported (based on Witness interviews) that the tsunami arrived from the northeast, with flooding of 3-7 m throughout the town. About 7 minutes after the first wave, a second, larger wave hit from the east carrying boats into the main town. The second wave completely flooded the first three rows of houses, and runup was measured around 5-10 m throughout the town. The UJNR survey team found two battery-operated clocks in this area that had stopped at 2237 and 2238. Fires ignited at 2240, and the combination of a strong, northeast wind and an ample supply of propane and kerosene (used for heating) spread the fire quickly, which burned through the night and destroyed 340 homes. Autopsies revealed that only two of the 114 deaths in Aonae were caused by fire. This section of Aonae was the hardest-hit developed area in spite of the fact that a massive, 4.5-m breakwater and 10-m high sand dunes reduced the runup to 5-10 m along the southeastern tip of the peninsula (Figures 1 and 4). In this regard, note that runup values rise rapidly again to the 10- to 20-m level a short distance northeast of the peninsula (Figure 4), probably due to the absence of breakwaters or sand dunes along this part of exposed coast.
The extent of damage to Aonae is illustrated in Figures 1 and 2. The breakwater in the foreground of Figure 1 is 4.5 m. The houses in the central part of the photograph were flooded by tsunami waves that ran up to a height of 5 m. To the right of these houses, one can see the smoking remains of over 200 houses. The area in the left portion of the photograph was a residential section before the tsunami. This area was completely stripped of all houses as seen in Figure 2, a view of the area from the south. The tsunami destroyed a portion of the seawall as seen in the lower right-hand portion of Figure 2. Although the seawall effectively reduces runup amplitudes, it was destroyed by wave forces pushing it seaward. Also note the scattered fishing boats in the center of the photograph. In both photographs, the remnants of the wooden structures are seen as the brown debris, completely covering the harbor area and outside the breakwater. These two photographs were taken from a helicopter the morning after the earthquake.
A similar refraction of the tsunami took place on the northern point of Okushiri Island at Inaho, where thirteen persons were killed and all houses were destroyed by waves that ran up over 10 m. The eastern side of Okushiri Island was less affected, where the tsunami runup was between 2 and 5 m. Subsidence was observed by Tsuji at Aonae, Okushiri, and Monai, while uplift was observed at Inaho Point. These data again suggest that Okushiri Island was part of the deformation area, which is consistent with the aftershock data.
The tsunami also hit the island of Hokkaido (Figure 5), arriving at Ota Bay within 5 minutes of the main shock and destroying five homes. Runup in this area was 9 m. Damage was also observed at Setana due to 6-m runup waves. The coastline from Suttsu to south of Ota Bay was hardest hit with runup values of 5-9 m. Outside this area, the tsunami intensity tapers off rapidly, and runup values fall below 5 m. The closest tide gauge to the earthquake was Esashi, which recorded a 2-m wave approximately 10 minutes after the main shock. Those data suggest that the eastern portion of the source was between Okushiri Island and Hokkaido.
The tsunami propagated to Russia within 30 minutes, where 1 - to 4-m tsunami runups were reported by Valentin Fedorey (Hydromet). Damage estimates were over $6 million, with $4 million in damage at Kamenka. After 90 minutes, the tsunami struck the coast of South Korea, where B. H. Choi of Sung Kyun Kwan University measured tsunami runup of 1-2 m.
The group is comprised of the following teams and members: Tohoku University team: N. Shuto (leader), H. Matsutomi; University of Tokyo team: Y. Tsuji (leader); Public Works Research Institute, Ministry of Construction team: H. Ito (leader), K. Yamamoto, Y. Iwasaki, K. Sasaki, A. Hattori; Port and Harbour Research Institute, Ministry of Transportation team: Y. Suzuki (leader), S. Takahashi, C. Goto, N. Hashimoto, T. Hosoyamada, T. Nagao; Civil Engineering Research Institute, Hokkaido Development Bureau team: Y. Mizuno (leader), K. Yano; United States-Japan Natural Resources team: E . Bernard (leader), F. Gonz6lez, D. Sigrist, H. Tsu ruya, K. Kato; Japan Meteorological Agency team: 0. Nagaoka (leader), S. Honda, H. Tatehata.
Direct correspondence to Eddie Bernard or F. I. Gonzalez, Pacific Marine Environmental Laboratory, NOAA Building Number 3, 7600 Sand Point Way N.E., Seattle, WA 98115; tel. 206-526-6800 or 206-526-6803, respectively.
Copyright 1993 by the American Geophysical Union 0096/3941/7437/93/417/$0 1.00.